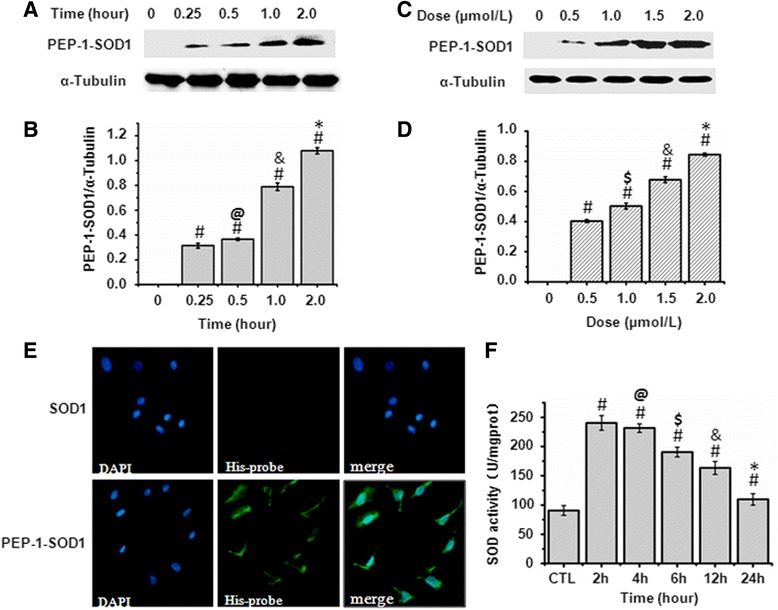
Fig. 1.

Transduction and enzyme activities of PEP-1-SOD1 fusion protein in MCF. a-d: Time and dose-dependent transduction of PEP-1-SOD1. a, b: 2 μM of PEP-1-SOD1 was incubated with cardiac myofibroblast for 0–2 h as indicated, and western blot was performed using anti-His tag antibody (a). b: Semi-quantitative assay was done in figure A. # P < 0.01 vs. untreated cells (CTL) group; @ P > 0.05 vs. 0.25 h group; &P < 0.01 vs. 0.5 h group; *P < 0.01 vs. 1.0 h group. (n = 5). c: 0-2 μM of PEP-1-SOD1 was incubated with cells for 2 h. Western blots were performed the same as in A. d: Semi-quantitative assay was done in figure C. # P < 0.01 vs. untreated cells (CTL) group; $ P < 0.05 vs. 0.25 h group; &P < 0.01 vs. 0.5 h group; *P < 0.01 vs. 1.0 h group. (n = 5). e: FITC-conjugated PEP-1-SOD1 transduction was detected by immunofluorescent microscopy. f: PEP-1-SOD1 exhibited SOD enzymatic activity in MCF. # P < 0.01 vs. untreated cells (CTL) group; @ P > 0.05 vs. 2 h group; $ P < 0.05 vs. 4 h group; &P < 0.05 vs. 6 h group; *P < 0.01 vs. 12 h group. (n = 5)
