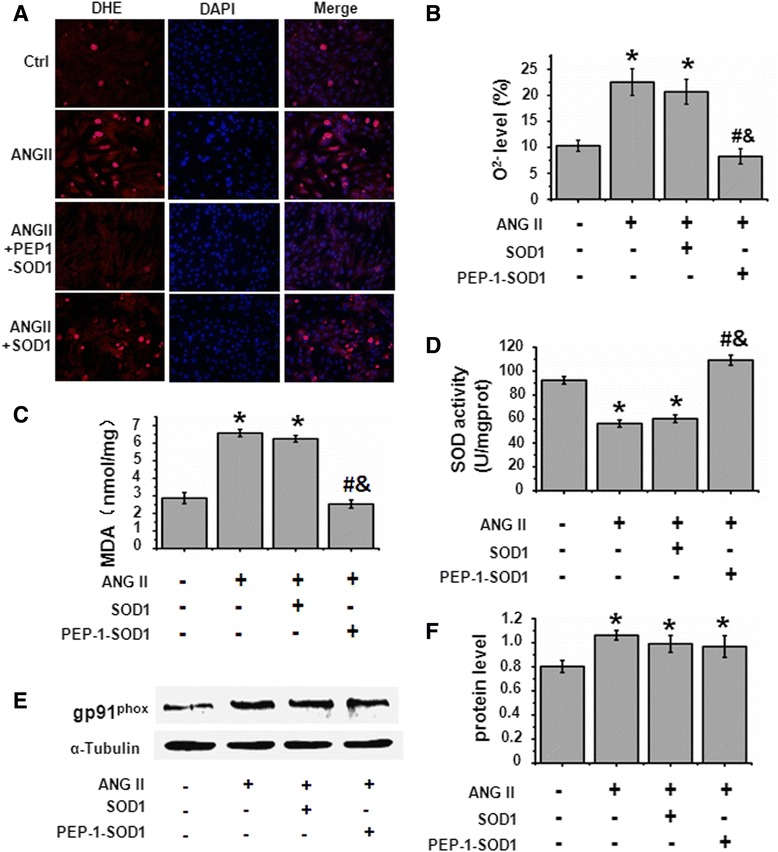
Fig. 2.

Effect of PEP-1-SOD1 on ANG II-induced ROS in MCF. a-b: O2 − levels were detected by fluorescent microscopy (a) and quantified by Flow Cytometry (b), respectively. Red color was indicated as the changes of O2 − levels in cells detected with oxidation-sensitive fluorescent probe dihydroethidium (DHE), Blue color was indicated as cell nucleus by DAPI staining. c: PEP-1-SOD1, but not SOD1, blocked Ang II-induced increase of MDA content. d: PEP-1-SOD1, but not SOD1, restored Ang II-blocked SOD activity. *P < 0.01 vs. Vehicle-treated cells (−), # P < 0.01 vs. Ang II-treated cells, &P < 0.01 vs. SOD1-treated cells (n = 5). e-f: gp91phox expression was analyzed by western blot (e) and normalized to α-Tubulin (f). *P < 0.01 vs. vehicle-treated cells (−) (n = 5)
