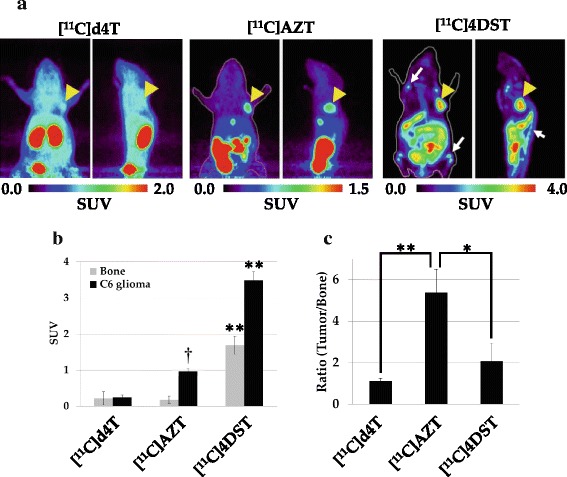
Fig. 5.

Comparisons of the in vivo accumulation level of thymidine analogs in C6 tumor-bearing mice. Summed PET images (60 to 80 min) of C6 tumor-bearing mice after injection of 50 MBq of [11C]AZT, [11C]d4T or [11C]4DST (a). The color code for the standardized uptake value (SUV) is shown at the bottom. Arrowheads indicate the C6 tumors. Arrows indicate bone or bone marrow regions. The graph in (b) shows the SUVs from PET images for tumor tissue and bone. Data are presented as means ± S.D. (n = 4 to 6). One way ANOVA;**P < 0.01 vs. [11C]AZT and [11C]d4T injected mouse. †P < 0.01 vs. [11C]d4T injected mouse. The graph in (c) shows the ratio of tumor-to-bone uptake of the labeled probes. One way ANOVA;*P < 0.05 vs. [11C]4DST injected mouse. **P < 0.01 vs. [11C]d4T injected mouse
