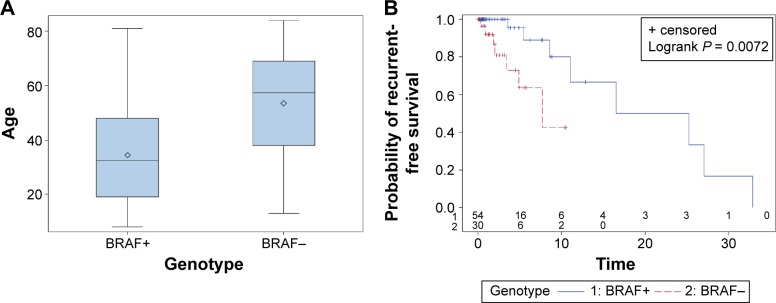
Figure 5.

Clinical and prognostic significance of the BRAF V600E mutation in ameloblastoma adapted from Brown et al.12 (A) Box plot showing a statistically significant difference in age distribution for BRAF V600E-mutated and BRAF wild-type ameloblastomas (P = 0.0007). Diamond indicates the mean, middle horizontal line indicates the median, box indicates 25th and 75th percentiles, and whiskers indicate minimum and maximum. (B) Recurrence-free survival (in years) for BRAF V600E-mutated and BRAF wild-type ameloblastomas using the Kaplan–Meier method.
