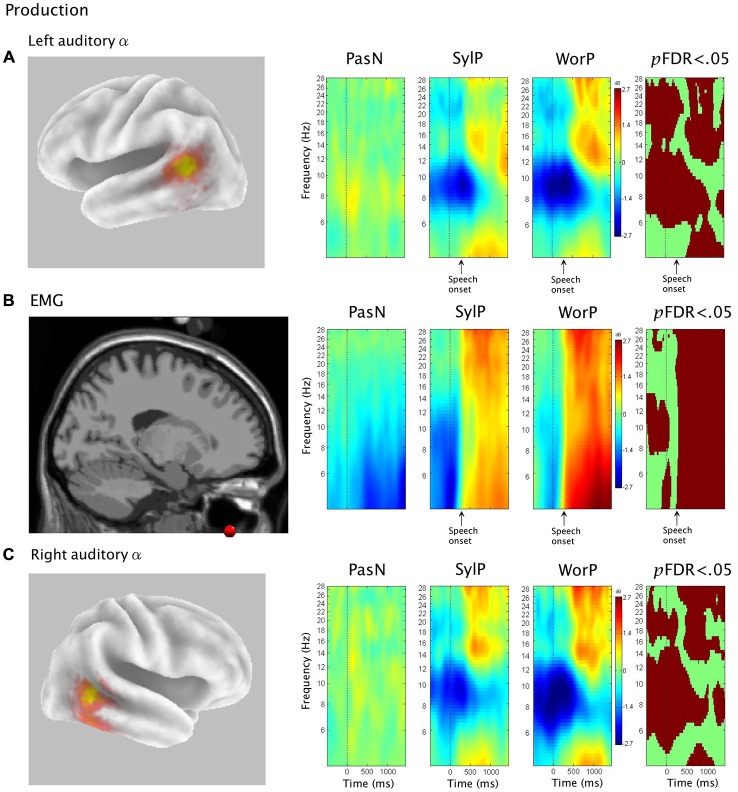
Figure 4.
The first column in rows (A) and (C) show sLORETA source solutions for left and right temporal α clusters, respectively, while the first column in row (B) shows the mean ECD localization of the peri-labial EMG cluster. The middle columns show event related spectral perturbation (ERSP) analyses, mapping ERS and ERD in the control condition (PasN) and production conditions (SylP and WorP). The far right column shows significant time-frequency differences in spectral power across conditions (p < 0.05, corrected for multiple comparisons). Time courses across ERSP analyses were identical, though rows (A,B) reference speech onset while row (C) references the timeline from Figure 1.

