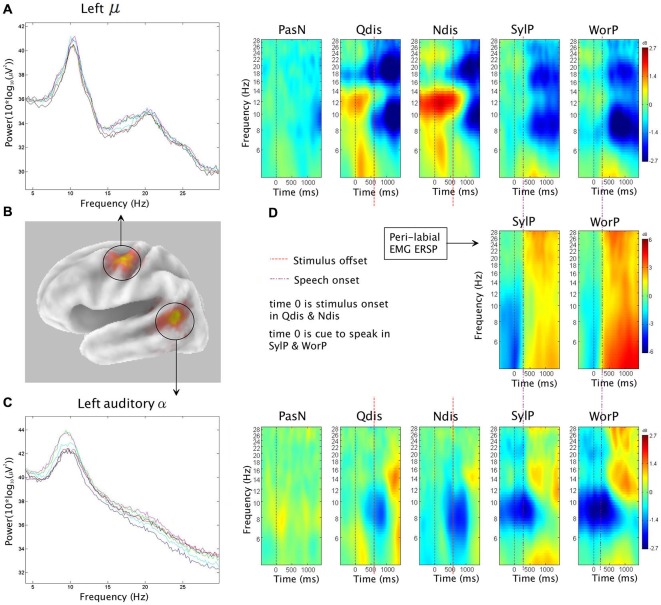
Figure 5.
The first column shows (B) sLORETA source solutions for the sensorimotor μ (reproduced from Jenson et al. (2014) with permission) and temporal α clusters, as well as mean spectra for (A) the sensorimotor μ cluster and (C) the temporal α cluster. Subsequent columns show ERSP analyses depicting patterns of corresponding ERS and ERD in the neural and (D) peri-labial myogenic clusters. In production conditions (SylP and WorP), the onset of peak peri-labial EMG activity (D) temporally aligns with the emergence of sensorimotor μ ERD (A) and temporal α ERS (C). In perception conditions (Qdis and Ndis), the emergence of sensorimotor μ ERD (A) temporally aligns with the emergence of temporal α ERS (C).

