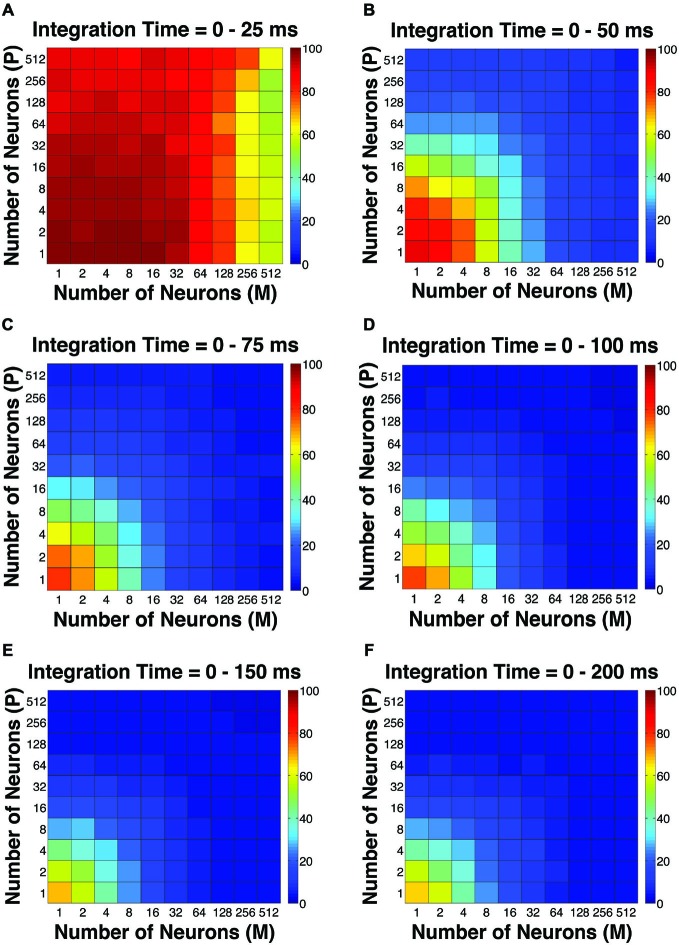
Figure 2.
The simulated “psychophysical” thresholds for different pool sizes (n) and integration time windows (t). Red indicates high threshold (100% contrast), whereas blue indicates low threshold (0% contrast). (A) t = 0–25 ms. (B) t = 0–50 ms. (C) t = 0–75 ms. (D) t = 0–100 ms. (E) t = 0–150 ms. (F) t = 0–200 ms.

