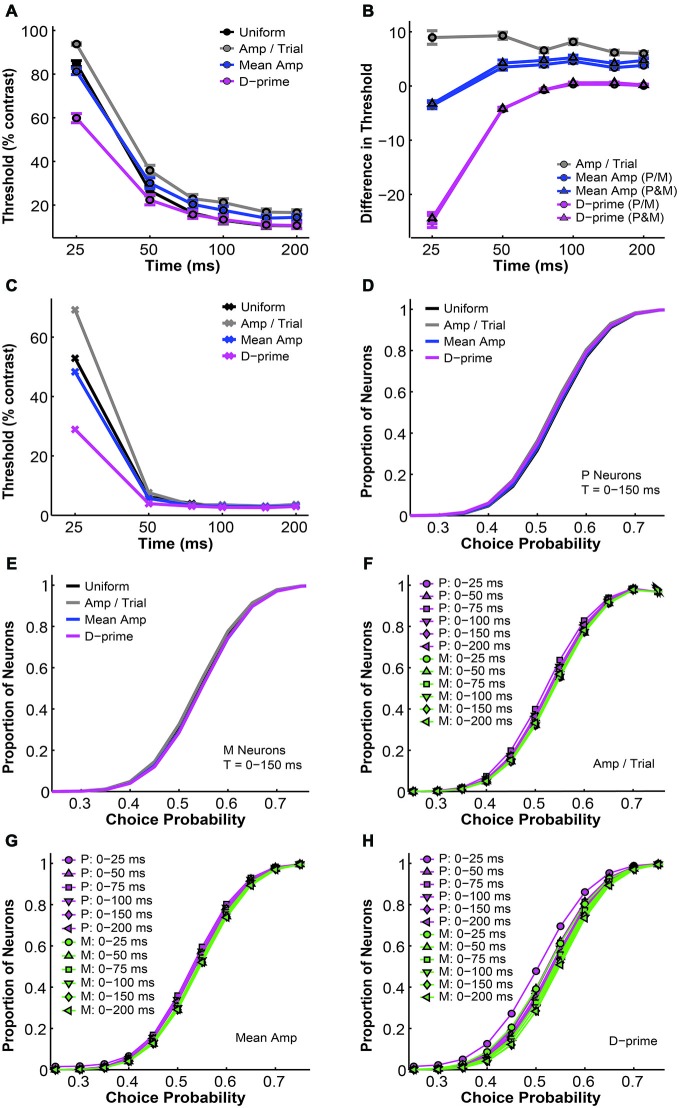
Figure 5.
A comparison of threshold and choice probability values derived from different pooling schemes. (A) The average psychometric threshold decreased with time in all pooling schemes (n = 1–512 neurons). Black: uniform pooling (as above); gray: every neuron weighted by its response amplitude in every trial; blue: every neuron weighted by its average response amplitude at high contrast (80–99%); magenta: every neuron weighted by its d-prime value at high contrast (80–99%); error bar: mean ± SEM. (B) Different pooling schemes yielded significantly different psychometric thresholds when compared with the uniform pooling model (n = 1–512 neurons). Gray: every neuron weighted by its response amplitude in every trial; blue with circle: every neuron weighted by its average response amplitude at high contrast (80–99%), with P and M neurons weighted separately in reference to their respective maximal responses; blue with triangle: every neuron weighted by its average response amplitude at high contrast (80–99%), with P and M neurons weighted together in reference to one maximal response; magenta with circle: every neuron weighted by its d-prime value at high contrast (80–99%), with P and M neurons weighted separately in reference to their respective maximal d-primes; magenta with triangle: every neuron weighted by its d-prime value at high contrast (80–99%), with P and M neurons weighted together in reference to one maximal d-prime; y axis: the difference in psychometric threshold (alternative pooling scheme—uniform, % contrast); error bar: mean ± SEM. (C) The minimal psychometric threshold achieved by the model decreased with time in all pooling schemes. (D,E) Cumulative choice probability distributions for P (D) and M (E) neurons (n = 512 neurons, t = 0–150 ms) in different pooling schemes. (F–H) Cumulative choice probability distributions for P (magenta) and M (green) neurons in different integration time windows (n = 512 neurons), with every neuron weighted by its response amplitude in every trial (F), by its average response amplitude (G), or by its d-prime (H).

