Fig. 2.

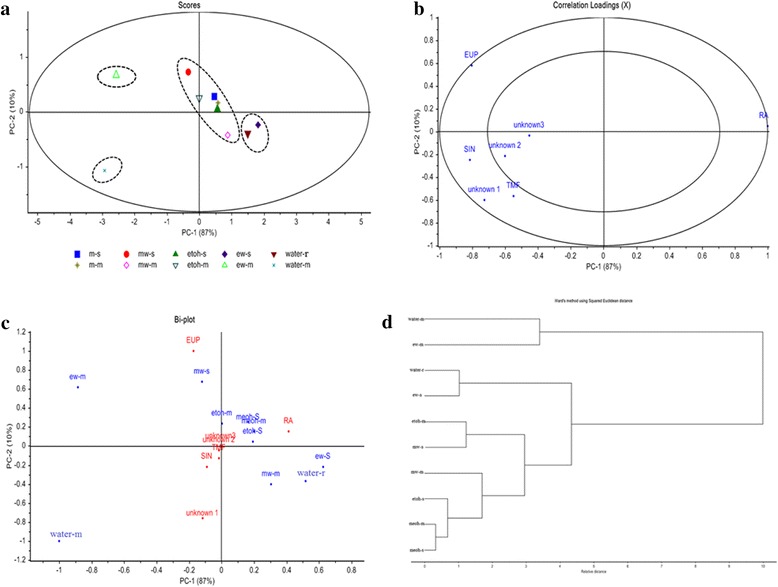
Principle component analysis of different extracts of O. stamineus leaves; a scores plot, b correlation loading, c Bi-plot and d HCA dendogram based on the PA/W values of seven common peaks

Principle component analysis of different extracts of O. stamineus leaves; a scores plot, b correlation loading, c Bi-plot and d HCA dendogram based on the PA/W values of seven common peaks