
Fig. 1.
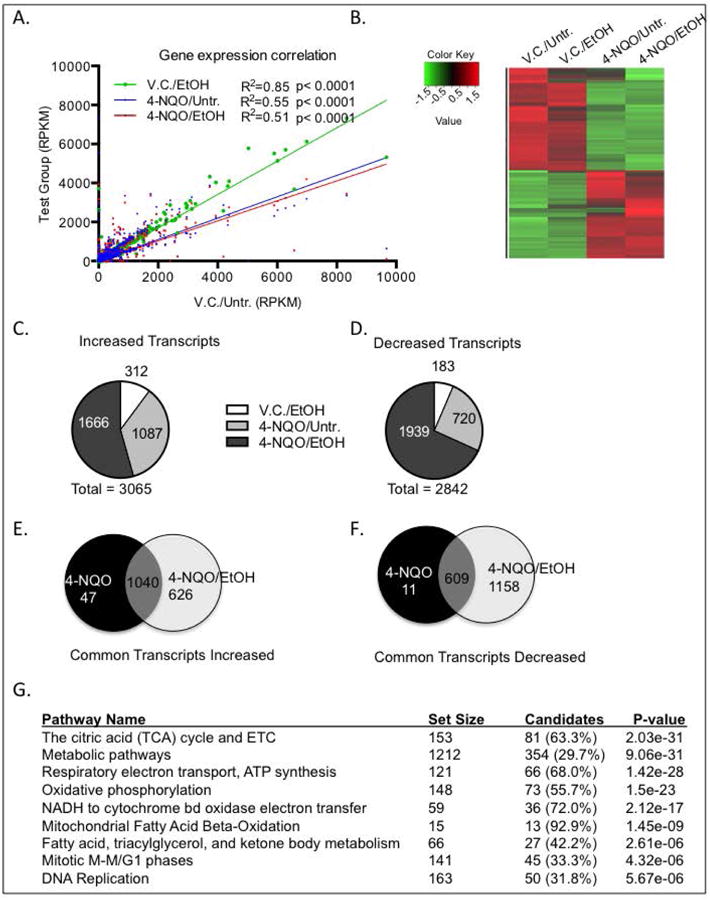
Ethanol and 4-NQO alter transcript levels in the tongues on a genome-wide scale. RNA was isolated from the tongues of the four different treatment groups and subjected to RNA-seq. (A) Gene expression correlation of total number of transcript levels (RPKM, reads per kilobase of transcript per million reads mapped) with at least a 2-fold change in in treatment groups (y-axis) compared to V.C./Untr. group (x-axis). Pearson correlation where p<0.05, R2=goodness of fit. (B) Heat map depicting genome-wide changes in transcript levels among all groups. Color scale is log2, red depicting increases and green depicting decreases. p<0.05 with at least a 2-fold change. (C & D) Pie charts depicting the numbers of transcripts increased (C), or (D) decreased compared to the V.C./Untr. group. (E & F) Venn diagrams depicting increased (E) or decreased (F) transcripts that are in common or unique to either 4-NQO/Untr. or 4-NQO/EtOH compared to the V.C./Untr. group. (G) Gene ontology analysis showing the top ten signaling pathways with the lowest p-values in the 4-NQO/EtOH treatment group that are changed compared to the V.C./Untr. group.