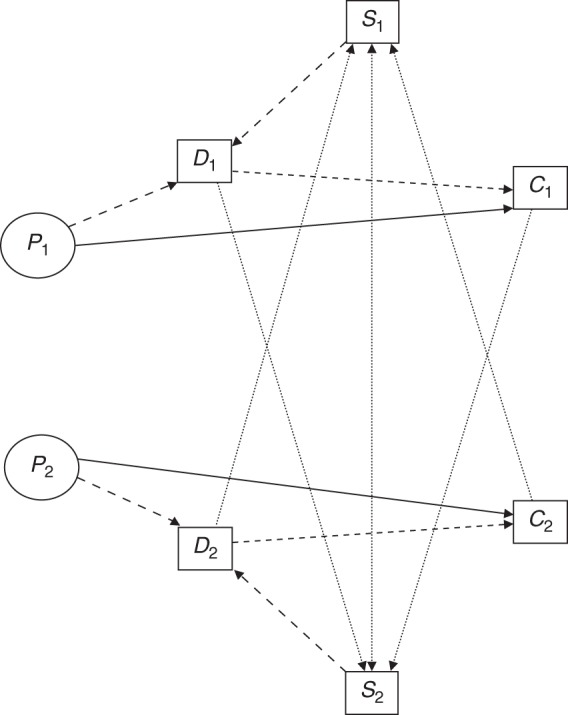
Figure 2.

Schematic representation of the model for screening, polyp detection, and cancer prevention for a pair of siblings (subscripts 1 and 2, respectively), where solid arrows denote biological progression; dotted arrows represent screening uptake; large dashed arrows represent polyp detection; and small dashed arrows represent cancer prevention. C, colorectal cancer; D, detected polyp; P, polyp; S, screening (colonoscopy).
