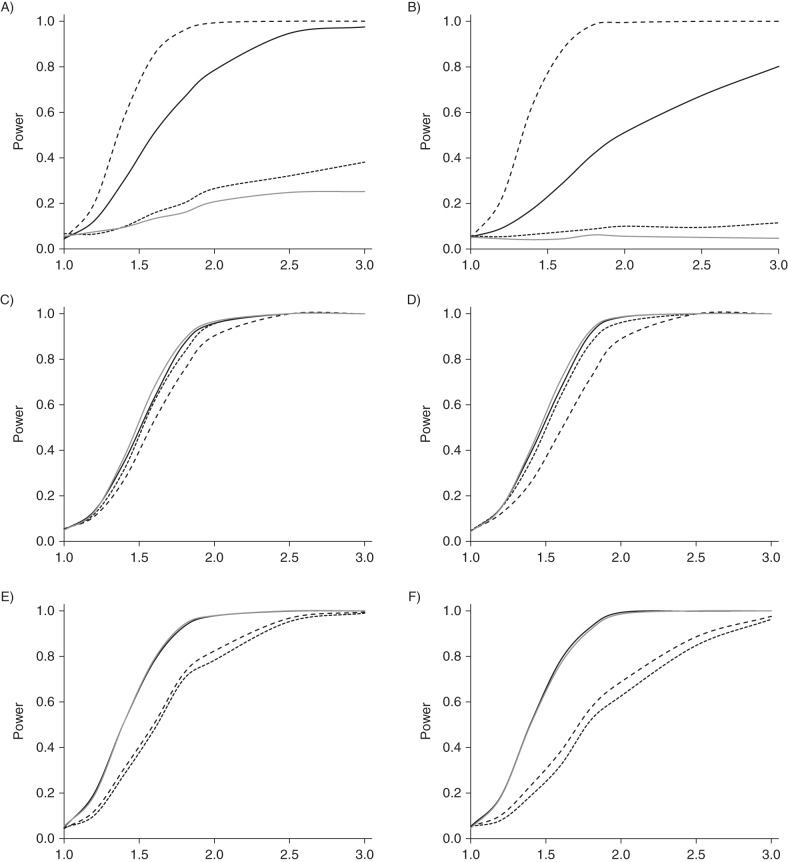
Figure 3.
Power curves for the 4 analyses: solid curves, colorectal cancer (CRC) versus no CRC (black, unadjusted; gray, adjusted for polyps); small dashed curves, CRC versus neither CRC nor detected polyp; large dashed curves, CRC or detected polyp versus neither. Left (A, C, E): Pr(screening | family history of polyps) = 0, Pr(screening | family history of CRC) = 0, and Pr(CRC prevented | polyp detected) = 0; right (B, D, F): Pr(screening | family history of polyps) = 0.25, Pr(screening | family history of CRC) = 0.75, and Pr(CRC prevented | polyp detected) = 0.50. Top (A and B), G1; middle (C and D), G2; bottom (E and F), G3. PR, probability; G1–G3, simulated genes related to CRC development through risk of polyps, risk of CRC but not polyps, and progression from polyps to CRC, respectively.

