

Summary
Splicing factor SRSF1 is upregulated in human breast tumors, and its overexpression promotes transformation of mammary cells. Using RNA-seq, we identified SRSF1-regulated alternative splicing (AS) targets in organotypic three-dimensional MCF-10A cell cultures that mimic a context relevant to breast cancer. We identified and validated hundreds of endogenous SRSF1-regulated AS events. De-novo discovery of the SRSF1 binding motif reconciled discrepancies in previous motif analyses. Using a Bayesian model, we determined positional effects of SRSF1 binding on cassette exons: binding close to the 5′ splice site generally promoted exon inclusion, whereas binding near the 3′ splice site promoted either exon skipping or inclusion. Finally, we identified SRSF1-regulated AS events deregulated in human tumors; overexpressing one such isoform, exon-9-included CASC4, increased acinar size and proliferation, and decreased apoptosis, partially recapitulating SRSF1's oncogenic effects. Thus, we uncovered SRSF1 positive and negative regulatory mechanisms, and oncogenic AS events that represent potential targets for therapeutics development.
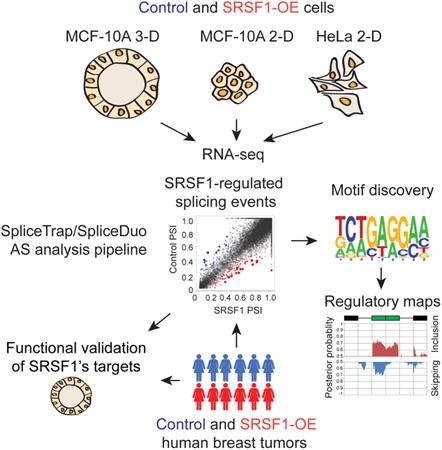
Graphical abstract
Introduction
Alternative splicing (AS) is a key control point in gene expression. In recent years, it has become clear that misregulation of splicing can contribute significantly to cancer malignancy by regulating the expression of oncogenes and tumor suppressors (Srebrow and Kornblihtt, 2006). Cancer cells often display aberrant AS profiles, which can arise due to mutations at the splice sites (SS) or splicing-regulatory elements, but can also reflect changes in the expression of splicing regulators (Srebrow and Kornblihtt, 2006). Recently, recurrent somatic mutations in components of the splicing machinery were identified in myeloid tumors (Yoshida et al., 2011), as well as sporadic mutations in lung and breast cancers, raising interest in the field and suggesting that alterations in splicing are an additional hallmark of cancer (Yoshida and Ogawa, 2014).
The core splicing machinery plus associated regulatory factors in eukaryotes comprises more than 300 factors. Splicing regulators can be classified into different groups. One major class of splicing factors is the serine/arginine-rich (SR) RNA-binding protein family. This family is composed of 12 members, each comprising one or two RNA-recognition motifs (RRM) and an RS domain (Long and Caceres, 2009). SR proteins act at multiple steps of the spliceosome cycle, and are involved in both constitutive and alternative splicing (Black, 2003). SR proteins can bind directly to a pre-mRNA and elicit changes in its AS in a concentration-dependent manner (Caceres et al., 1994; Mayeda et al., 1992). Thus, changes in the expression of these proteins can regulate AS of many genes and are likely involved in AS deregulation in cancer, even in the absence of mutations.
The splicing factor SRSF1 (previously known as SF2/ASF) is a prototypical SR protein that, in addition to its function in splicing, also plays a role in nonsense-mediated mRNA decay, mRNA export, and translation (reviewed in Das and Krainer, 2014). Although SRSF1 is frequently overexpressed in human tumors (Karni et al., 2007), the biological consequences of its overexpression in cancer are only beginning to be unraveled. We recently demonstrated that overexpressing SRSF1 alone promotes transformation of mammary epithelial cells, both in vitro and in vivo (Anczukow et al., 2012). Using a candidate-gene approach, we identified several AS events that partially contribute to SRSF1's oncogenic activity (Anczukow et al., 2012).
Although SRSF1 has been extensively studied for over two decades, our knowledge about its target specificity and regulation is still limited. Most of the known SRSF1 AS targets have been investigated in transient assays using either minigenes transfected into HeLa or HEK293 cells, or using in vitro binding (Tacke and Manley, 1995; Ray et al., 2009; Ray et al., 2013), functional SELEX (Cartegni et al., 2003; Liu et al., 1998; Schaal and Maniatis, 1999; Smith et al., 2006), or CLIP assays (Sanford et al., 2008; Sanford et al., 2009). Only a handful of endogenous SRSF1 AS targets have been reported to date, and accurately predicting bona fide SRSF1 AS targets remains a major challenge. Two studies involving microarray analysis after SRSF1 knockdown reported endogenous AS targets in flies (Blanchette et al., 2005) and in mouse cells (Pandit et al., 2013), but the relevance of these targets to human disease has not been established. Furthermore, a surprisingly low correlation was reported between SR protein binding and splicing changes in a set of murine endogenous targets (Pandit et al., 2013). Although these experiments provided information about SRSF1's binding specificity and mechanism of action, the extent to which these findings are relevant to SRSF1's functions in normal as well as cancer cells remains unclear. Here we have systematically identified human SRSF1-regulated AS splicing events, using next-generation RNA-sequencing (RNA-seq) in a cell-culture system relevant to breast-cancer pathogenesis.
Results
Identifying SRSF1 splicing targets by RNA-seq
To define SRSF1-regulated AS events involved in SRSF1's oncogenic activity, we used a model system that recapitulates important features of mammary-gland morphogenesis and architecture: human non-transformed mammary epithelial MCF-10A cells, which form acini when grown in 3-D culture in Matrigel—a basement-membrane-like extracellular matrix (Debnath and Brugge, 2005). These cells undergo a program of proliferation and apoptosis to form organized, proliferation-arrested, polarized structures with a hollow center. It is well established that the 3-D organization of the glandular epithelium is an important parameter that influences cell physiology, and that epithelial cells grown in 3-D culture more closely recapitulate the biological conditions than monolayer cultures grown on plastic (Debnath and Brugge, 2005). Signaling pathways are differentially regulated in cells grown in 3-D versus 2-D cultures (Bissell et al., 2005). Oncogenic stimulation of epithelial cells grown in 3-D can lead to deregulation of proliferation and apoptosis, and acquisition of invasive properties (Debnath and Brugge, 2005). We previously showed that ∼2-fold overexpression of SRSF1, which conservatively mimics the levels observed in human tumors, increased MCF-10A acinar size by promoting proliferation and delaying apoptosis, similar to the effect of certain oncogenes relevant to breast cancer (Anczukow et al., 2012). Here we took advantage of this system to systematically characterize the AS events underlying the transformed phenotype.
We performed RNA-seq of duplicate RNA samples from 3-D or 2-D control or SRSF1-overexpressing (SRSF1-OE) MCF-10A cells (Anczukow et al., 2012). SRSF1-OE acini were significantly larger than control acini, as expected (Figure 1A) (Anczukow et al., 2012). In addition, we used inducible SRSF1-OE HeLa cells (Fregoso et al., 2013) for comparison, to identify AS events specific to MCF-10A cells. The level of SRSF1 overexpression, 2-3 fold compared to endogenous SRSF1, was similar in both MCF-10A and HeLa cells (Figure 1B), and comparable with the level observed in human breast tumors (Karni et al., 2007). We mapped paired-end reads to the human exon-trio Txdb database (Wu et al., 2011) and quantified exon inclusion using our SpliceTrap/SpliceDuo pipeline (Figure 1C). SpliceTrap is a method to quantify the percentage of exon inclusion, also known as “percent spliced in” or PSI (Venables et al., 2008), using RNA-seq data (Wu et al., 2011) (see Experimental Procedures). It quantifies the extent to which every exon is included, skipped, or subject to size variations due to alternative 3′/5′-SS use or intron retention.
Figure 1. Identification of SRSF1-regulated splicing events by RNA-seq.
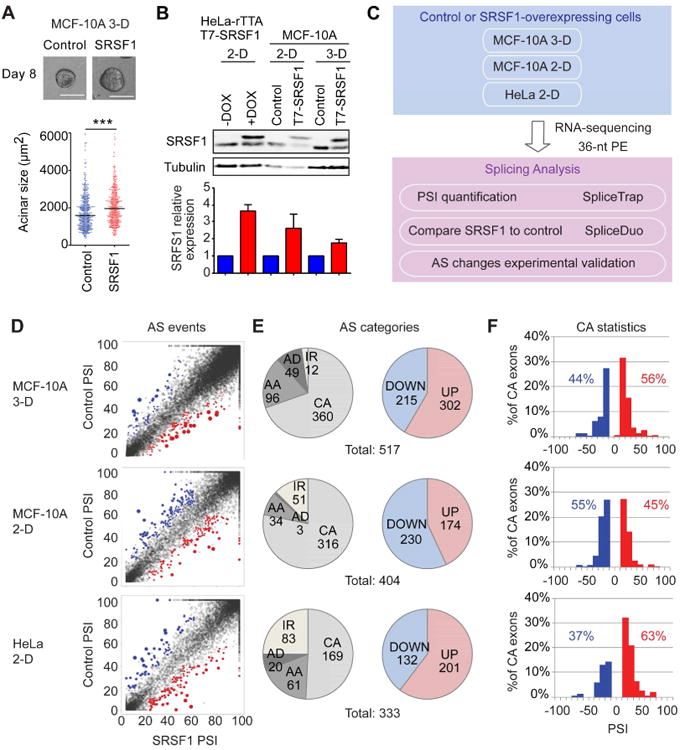
(A) Acinar morphology and size of control or SRSF1-OE 3-D-grown MCF-10A cells. Scale bar: 100 μm. The dot plot shows the size distribution and median size. (>100 acini per experiment; Mann-Whitney test *** P<0.0005). (B) Western blot analysis of SRSF1 protein levels in inducible HeLa cells with or without doxycycline (DOX), as well as in control or SRSF1-OE 2-D or 3-D grown MCF-10A cells. Normalization relative to tubulin loading control (n=3). Error bars, s.d. (C) RNA-seq experiment and data-analysis flow-chart. (D) PSI profiles of the AS events identified in control and SRSF1-OE cells. The colored dots represent significantly upregulated (red) or downregulated (blue) AS events in SRSF1-OE compared to control cells. (E) Number of AS events in each category: CA-Cassette exons, AA-Alternative Acceptors (3′ SS), AD-Alternative Donors 5′ SS), IR-ntron Retention; DOWN/UP-AS event downregulated/upregulated in SRSF1-OE cells. (F) Skipped (blue) and included (red) SRSF1-regulated CA-exons plotted by PSI.
Unlike the large dynamic range of gene-expression values observed in RNA-seq data (e.g., RPKM values), exon-inclusion profiles are restricted to a small range of probability-like values (from 0 to 1) with a beta (“U”-shaped) distribution (Wu et al., 2011). It is therefore challenging to assign statistical significance to PSI changes using the variance of the data (ΔPSI, PSI fold change), or to implement parametric methods, such as the t-test, to identify significant outliers. Thus, we developed SpliceDuo, a non-parametric implementation of the Thin Plate Spline (TPS) transformation (Whaba, 1990) to capture the distribution of relative AS changes and assign statistical significance. The TPS transformation produces a probability density model based on the dispersion of AS changes across two conditions. This model is then used to estimate the false discovery rate (FDR) of each AS change in terms of their pairwise deviation from the density distribution (see Experimental Procedures).
For each of the samples analyzed, the majority of unique reads mapped to exonic regions, as expected, with more than half of the reads mapping to protein-coding sequences. We identified a total of 517 SRSF1-regulated AS events in 3-D MCF-10A acini, 404 events in 2-D MCF-10A cells, and 333 events in HeLa cells (Figure 1D and Table S1) at a cutoff of FDR≤0.1. More than half of these AS events correspond to cassette exons (CA) (Figure 1E). Alternative 3′ SS or “acceptor” (AA) events were the second most common class of SRSF1-regulated AS events (Figure 1E), followed by alternative 5′ SS or “donor” (AD) events. Intron retention (IR) events were more frequently detected in cells grown in 2-D, compared to 3-D cultures (Figure 1E). SRSF1 promoted a similar number of exon inclusion and skipping changes (Figure 1F), suggesting a dual role for SRSF1 as a splicing activator and repressor, either directly through RNA binding, or indirectly through secondary interactions.
Among the SRSF1-regulated CA-exons, we detected 60 events in common between 3-D and 2-D MCF-10A cells, 37 events in common between 2-D MCF-10A and HeLa cells, 32 events in common between 3-D MCF-10A and HeLa cells, and 5 across the three experiments (Table S2). In general, the overlap ranged between 11% and 28%, which, though limited, is highly significant, assuming a random probability of coincidence between any pair of experiments (see Fisher's exact P-values and Figure S1A). This limited overlap likely reflects experimental or cell-type differences, but also suggests that the RNA-seq detection sensitivity is not saturated. Accordingly, previous studies showed similar overlaps in AS target identification, using different experimental and/or computational methods (Pandit et al., 2013; Wang et al., 2014).
Splicing-event validations
To assess the accuracy of our RNA-seq analysis of splicing changes, we individually measured the AS of 141 predicted CA-exons across the three different cellular conditions (Figures 2, S1-S3 and Table S2). We sampled SRSF1-regulated AS events observed in at least one condition, from among the strongest as well as the weakest AS changes (Table S2). In addition, we selected AS events not regulated by SRSF1 as negative controls (Figure S2C). We performed radioactive RT-PCR in triplicate, using primers that amplify both the included and the skipped isoforms (Figures S2-S3, and Table S2). We also performed validations using different RNA samples, in addition to the samples used to generate the RNA-seq libraries (Figure S2D).
Figure 2. SRSF1-regulated CA-exons in 2-D or 3-D MCF-10A cells.
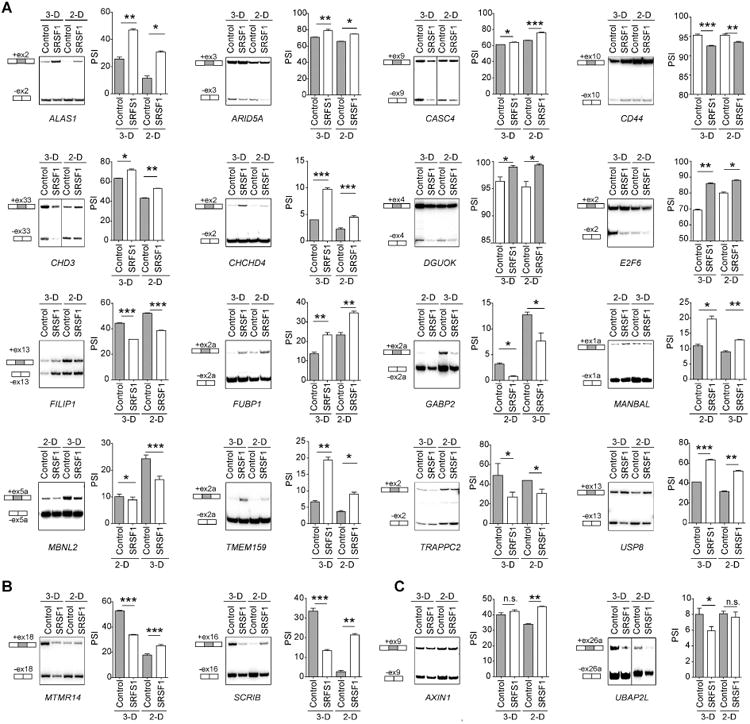
Representative RT-PCR validations of SRSF1-regulated CA events altered in: (A) the same direction in 2-D and 3-D; (B) in opposite directions in 2-D and 3-D; (C) in 2-D or 3-D but not both. Total RNA was analyzed by radioactive RT-PCR using primers in the upstream and downstream exons, followed by native PAGE and autoradiography. The structure of each isoform is indicated (not to scale). CA- exons are shaded. The percent spliced in (PSI) was quantified for each condition (n≥3; t-test *** P<0.0005, ** P<0.005, * P<0.05). Error bars, s.e.m). See Figures S1-S2 for additional validations.
104 out of 141 tested CA events were successfully validated, including 58 exon-inclusion and 46 exon-skipping events across the different cell lines (Table S2, Figures S1-S3). We also validated 7 out of 7 tested AA events, 3 out of 3 tested AD events, and 1 out of 1 tested IR event in MCF-10A 3-D cells (Figures S1-S3 and Table S3).
Among the validated CA-exons, 24 AS events showed consistent changes between the 3-D and 2-D SRSF1-OE cells (Figure 2A and Table S2). In contrast, two AS events exhibited opposite changes (Figure 2B and Table S2); for example, we observed differential splicing of the epithelial-cell polarity regulator Scribble in 3-D compared to 2-D cells (Figure 2B). These mRNAs encode different protein isoforms that may exhibit distinct biological functions in polarized versus non-polarized cells. In addition, several AS events were specifically regulated by SRSF1 in 3-D MCF-10A cells, but remained unchanged in 2-D cells, or vice-versa (Figure 2C and Table S2), illustrating differential AS regulation between 3-D and 2-D conditions. Finally, we identified multiple SRSF1-regulated CA-exons that exhibited reciprocal splicing changes in SRSF1-OE MCF-10A cells versus SRSF1-depleted MEFs (Pandit et al., 2013) (Table S2), suggesting conserved regulatory mechanisms.
Overall, the validation rate for CA was 74%, although this rate dramatically increased if only RNA-seq true positives were considered, with more stringent FDR or |AS change| cutoffs (Figure S1B). For example, at FDR≤0.03 the validation rate increased to 88%, whereas at |AS change|≥ 0.5 it was 100% (Figure S1C).
SRSF1 motif analysis
We then performed de-novo discovery of the SRSF1 binding motif, using only the sequences of our predicted targets and no binding information (e.g., from CLIP-seq data). We used the sequences of the SRSF1-regulated CA exons shared between 3-D and 2-D MCF-10A cells to derive an SRSF1 motif (Figure 3A) with the psp-MEME or seeded psp-MEME tools (Figure S4A). The motifs derived from this training set were then successfully tested using a set of different CA events that showed overlap between MCF-10A and HeLa cells (Figure 3A and Table S2). Furthermore, we did not detect significant enrichment for binding motifs for other splicing factors in the training or test sets (Table S4).
Figure 3. SRSF1-motif discovery and in vitro validation.
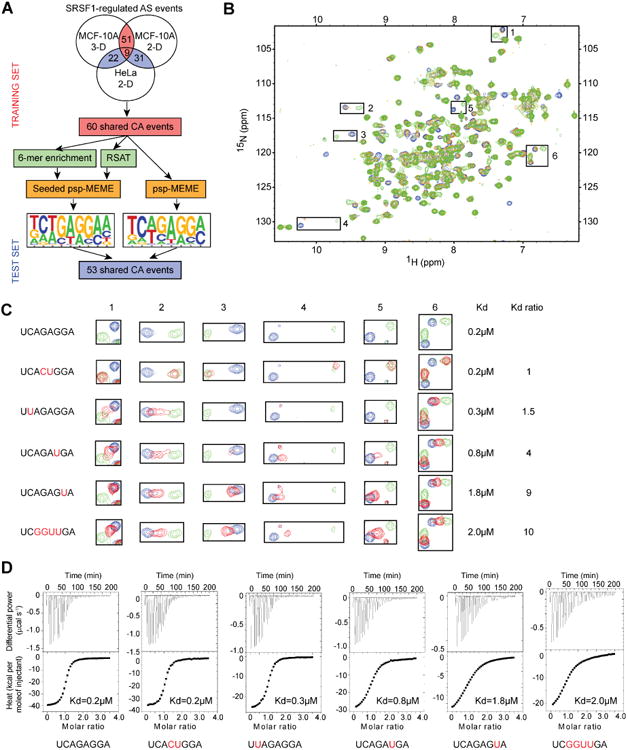
(A) Flowchart of the SRSF1-motif discovery from the RNA-seq data. (B-D) Study of the interactions between SRSF1 RRM1+2 with WT and mutated versions of 5′-UCAGAGGA-3′ RNA. (B) Superimposition of 1H-15N HSQC spectra representing NMR titration of the 15N-labeled GB1-SRSF1 RRM1+2 protein with increasing amounts of unlabeled 5′-UCAGAGGA-3′ RNA. The peaks corresponding to the free and RNA-bound protein states (at RNA:protein ratios of 0.3:1 and 1:1) are colored blue, orange and green, respectively. The largest chemical shift perturbations observed upon RNA binding are indicated by black squares. (C) Close view of the chemical shift perturbations boxed in (B). The Kd determined by ITC in panel D and Kd ratios are indicated on the left side of the panel for each RNA sequence tested. (D) ITC data of GB1-SRSF1 RRM1+2 with WT and variants of the 5′-UCAGAGGA-3′ RNA. The estimated Kd values are shown.
Strikingly, the present RNA-seq-derived SRSF1 motif is closely related to previously derived motifs from SELEX (Smith et al., 2006; Tacke and Manley, 1995) and CLIP experiments (Pandit et al., 2013; Sanford et al., 2008; Sanford et al., 2009) (Figure S4B), even though the latter two motifs appear different from each other (Figure S4C). Moreover, the RNA-seq-derived motif consistently identifies previously characterized SRSF1 targets, with predictive power comparable to that of the older motifs (Figure S4D).
In addition, 44 of the CA-exons we identified overlap with previously detected SRSF1 CLIP-tags in HEK293 cells (Sanford et al., 2008; Sanford et al., 2009), and 114 events overlap with CLIP-tags in MEFs (Pandit et al., 2013) (Table S2). We then validated by RT-PCR in MCF-10A cells 9 out of 18 tested CA exons overlapping with SRSF1 CLIP-tags (Figures 2 and S2).
To further experimentally validate the RNA-seq-derived SRSF1 motif, we performed nuclear magnetic resonance (NMR) and isothermal titration calorimetry (ITC) titrations with SRSF1 RRM1+RRM2 and wild-type (WT) or mutated versions of a 5′-UCAGAGGA-3′ RNA oligonucleotide (Figure 3B-D). The WT and UCACUGGA mutant interacted equally well with SRSF1 RRM1+RRM2 (Figure 3B,C). This is in agreement with recent data suggesting that SRSF1 RRM2 binds the 5′-GGA motif (Clery et al., 2013), and with our SRSF1 motif, which allows either a GA or a CU dinucleotide at position 4-5. For the four additional RNAs mutants (UCAGAGUA, UCAGAUGA, UUAGAGGA, and UCGGUUGA), the chemical shift perturbations observed upon RNA binding were shorter than in the presence of the WT RNA (Figure 3B,C). This apparent decrease in affinity was confirmed by the ITC measurements (Figure 3D). The combined NMR and ITC results confirm the validity of the RNA-seq-derived SRSF1 motif.
In addition, we performed a mutational analysis using a reporter minigene containing variants of the RNA-seq-derived SRSF1 motif (Figure S4E-G). Briefly, the SRSF1 motif TCAGAGGA was introduced at positions 44-51 of SMN2 exon 7 (SRSF1 C1 variant). We tested six mutants predicted to abolish SRSF1 binding because of mismatches to the consensus SRSF1 motif (M1 to M6 sequences), and 13 variants with more permissive nucleotide changes that still match the consensus SRSF1 motif (C2 to C14 sequences) (Figure S4E). In this exonic context, an A at position 8 of the motif was required for exon inclusion (mutants C5 and C10), but could be compensated for by an A at position 6 (mutants C7 and C8) (Figure S4F,G). In addition, as predicted from the RNA-seq-derived consensus motif, a T at position 7, a C at position 1, and a T at position 2, were each required for exon inclusion (mutants M1-M3) (Figure S4F,G). Mutants M4-M6 were predicted to prevent SRSF1 binding, but did not inhibit splicing activation in this context. These exceptions might be due to the fortuitous creation of binding sites for other RNA-binding proteins that promote splicing upon disruption of the SRSF1 site; indeed, the M4-M6 mutations created TRA2β and hnRNPF motifs and weakened hnRNPH1 motifs. Overall, the minigene mutational analysis is consistent with the in vitro binding results, and supports our consensus RNA-seq-derived SRSF1 motif.
SRSF1 regulatory maps
Splicing regulatory maps are useful to uncover positional effects of splicing-factor binding sites in exons and introns (Huelga et al., 2012; Licatalosi et al., 2008; Pandit et al., 2013). Briefly, these are motif-density profiles derived from CLIP-seq data or in-silico predictions, which after normalization (e.g., by the sequence size) and smoothing (e.g., by moving average) are visualized as density units (e.g., normalized complexity). To gain a better understanding of the SRSF1 regulatory mechanisms, we constructed regulatory maps (Figure 4 and S5). We examined 113 SRSF1 targets from both the training and test RNA-seq-derived datasets, in addition to splicing microarray data from SRSF1-depleted murine MEFs cells (Pandit et al., 2013) and SRSF1 CLIP analysis of human HEK293 cells (Sanford et al., 2008; Sanford et al., 2009). To evaluate differential roles of SRSF1 in splicing activation and repression, we treated included and skipped CA-exons separately. SRSF1-regulated CA-exons, as well as upstream and downstream exons and introns, were queried against the motifs, and density likelihood functions were computed (Figure S5A). Finally, we used the Bayesian rules of inference to derive the posterior probabilities (PP) of SRSF1 binding at each sequence position. We constructed a total of nine SRSF1 regulatory maps by screening the three datasets above with three SRSF1 motifs: a functional-SELEX-derived motif (Smith et al., 2006), a CLIP-derived motif (Sanford et al., 2008) and the RNA-seq-derived motif (Figure S5B-D). The main differences between our regulatory maps and previous ones (Huelga et al., 2012; Licatalosi et al., 2008; Pandit et al., 2013) are that: (i) our model reports probabilities, rather than density units, because they are more intuitive; (ii) whereas previous studies report background models as independent control curves (e.g., non-SRSF1 target CA-exons), our model incorporates this information as marginal probabilities, making it visually simpler; and (iii) our model does not require smoothing, because it uses prior probabilities and “expanding windows” (see Experimental Procedures).
Figure 4. SRSF1 regulatory maps and mutational analysis.
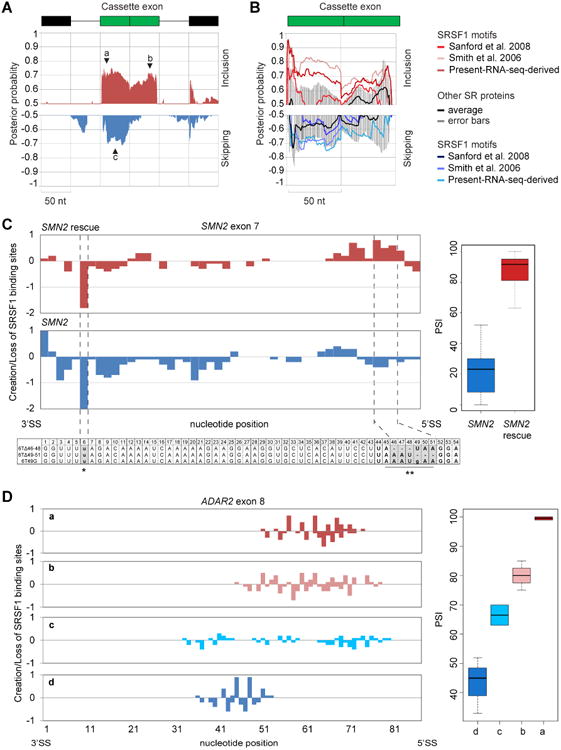
(A) Position-dependent binding probabilities of SRSF1 along included (red) or skipped (blue) CA-exons and surrounding sequences. The x axis represents the nucleotide position relative to the CA (green box), upstream and downstream exons (black boxes). The line represents 100-nt of the surrounding introns. The y axis shows the median probabilities of nine different regulatory maps derived using three different SRSF1 motifs across three independent datasets (see Figure S4 for individual dataset plots). Black triangles indicate the position of the peaks with the highest posterior probability for exon inclusion or skipping. (B) Binding probabilities of SR proteins were averaged together (SRSF2, SRSF3, SRSF5, SRSF6 and SRSF7) (black line), plotted with the corresponding standard deviations (grey bars) and compared to SRSF1's binding profiles derived with three different SRFS1 motifs (red and blue lines) in the present RNA-seq dataset. (C-D) Correlation between creation or loss of SRSF1 motifs and exon inclusion in SMN2 exon 7 (C) and ADAR2 exon 8 (D). SRSF1 motif creation (positive scores) or loss (negative scores) were scored for mutations promoting high (red) or low (blue) exon inclusion (PSI), at each nucleotide position (left panel) and plotted along with their corresponding PSI levels (right panel).
We observed that SRSF1 binding sites located in CA-exons near the 5′SS promote exon inclusion (PP>0.7) but not exon skipping (PP<0.5). In contrast, SRSF1 motifs found in CA-exons near the 3′SS are indistiguishably associated with either exon skipping or inclusion (PP>0.7 for both). This trend can be clearly seen in the median curve summarizing all the regulatory maps (Figure 4A) but also in each curve separately (Figure S5B-D). To test the specificity of our findings, we compared SRSF1 regulatory maps to those generated using other SR protein motifs (SRSF2, SRSF3, SRSF5, SRSF6, and SRSF7) in conjunction with SRSF1-associated CA-exons identified by RNA-seq. In the exon-inclusion dataset, a high PP was detected for two of the three SRSF1 motifs (RNA-seq-derived motif and functional SELEX motif) but not for the other SR proteins, whereas exon skipping was associated with binding by either SRSF1 or the other SR proteins (Figure 4B). This observation suggests that SRSF1 can function independently as a splicing activator, whereas its activity as a repressor likely involves interaction with other splicing regulators.
As an experimental validation of the position-dependent effect of SRSF1 binding, we reanalyzed published data from mutational analyses, and correlated the creation or loss of SRSF1 motifs with exon inclusion in two different context: SMN2 exon 7 and ADAR2 exon 8 (Figure 4C,D). We first exploited a collection of mutations in SMN2 exon 7 (see Experimental Procedures), which assessed the effect of nearly every nucleotide change on the level of exon 7 inclusion. SMN1 and SMN2 differ from each other mainly by a single nucleotide transition in exon 7 (C6T) which abrogates a binding site for SRSF1, thus promoting exon skipping (Cartegni and Krainer, 2002). We searched for mutations that create SRSF1 motifs in high-inclusion but not in low-inclusion SMN2 mutants. Hypothetically, such mutations could explain the rescue of exon 7 inclusion notwithstanding the C6T mutation. We scored for SRSF1 motif creation (positive scores) or loss (negative scores) in 22 SMN2 mutants with high exon 7 inclusion and 22 with (unchanged) low exon 7 inclusion. In agreement with our SRSF1 regulatory maps, mutations that promoted exon inclusion also created SRSF1 motifs near the 5′ SS; moreover, there was no SRSF1 motif enrichment for the mutations that did not promote exon inclusion (Figure 4C).
In parallel, we analyzed a collection of mutants in ADAR2 exon 8 (Goren et al., 2006) in which an SRSF1 motif was systematically inserted along different positions of the exon to study positional biases (Figure 4D). Once again, we correlated exon-inclusion levels with the creation or loss of an SRSF1 motif. Mutations that caused high exon inclusion (75-100%) created SRSF1 motifs close to the 5′SS; in contrast, mutations that did not strongly promote exon inclusion did not exhibit such a positional bias (Figure 4D). Thus, in agreement with our SRSF1 regulatory maps, both examples indicate that binding of SRSF1 near the 5′SS but not the 3′SS is associated with promoting exon inclusion.
SR protein binding to constitutive exons plays a role in SS selection and exon definition (Ram and Ast, 2007). Accordingly, we observed an inverse correlation between the strength of both SSs and the number of SRFS1 motifs in the 113 CA-exons used to build the regulatory maps (Table S5). A closer look at the 20 strongest and 20 weakest SS pairs revealed a greater tendency for SRSF1 motifs to accumulate within 60 nt downstream of the weak 3′ SS (34 motifs, Fisher' Exact P-value=0.04) as opposed to the strong 5′ SS (15 motifs) or strong 3′/5′SS (7 and 9 motifs respectively). Thus, our findings suggest that the presence of SRSF1 motifs next to the 3′SS in both exon skipping and inclusion contexts is associated with constitutive exon definition and SS selection, whereas a positional bias towards the 5′SS relates to the role of SRSF1 as an activator of exon inclusion.
SRSF1-regulated pathways in breast cancer
To further assess the basis of the oncogenic impact of SRFS1 in breast cancer, we investigated the biological functions and molecular pathways deregulated upon SRSF1 overexpression in the mammary-gland context. We determined SRSF1-induced expression changes using DEseq (Anders and Huber, 2010) on the read counts from our 3-D or 2-D MCF-10A RNA-seq data (Table S6). SRSF1 overexpression promoted mostly upregulation of genes, in both 3-D and 2-D MCF-10A cells, accompanied by an enrichment of genes involved in carcinogenesis and RNA biology (Figure S6A). Pathway-enrichment analysis using Ingenuity Pathway Analysis suggested that changes in cells grown in 3-D are associated with biological functions connected to breast cancer. In contrast, changes in the 2-D cells had little relevance to the mammary cell type (Figure S6B), highlighting the advantages of using an organotypic culture model to identify biologically relevant targets. In addition, pathway-enrichment analysis suggested that genes alternatively spliced in SRSF1-OE cells are associated with gene-expression regulation, post-transcriptional metabolism, cell cycle and cell growth, as well as cell assembly and organization (Figure S6C,D). Interestingly, 3-D and 2-D SRSF1-OE cells affected more similar pathways when comparing their AS changes than when comparing their gene-expression changes.
Splicing targets involved in SRSF1's oncogenic activity
Using the MCF-10A 3-D acini, we identified SRSF1-regulated AS targets in a model system in which the only manipulated variable was the overexpression of SRSF1. However, we are especially interested in identifying SRSF1-regulated AS events that also occur in human tumors, and are thus more likely to be relevant to cancer. To determine which SRSF1-regulated AS events may play a role in breast cancer, we applied the SpliceTrap/SpliceDuo pipeline to a collection of human breast tumors from The Cancer Genome Atlas (TCGA) (http://cancergenome.nih.gov). We selected 57 tumors with ≥2-fold overexpression of SRSF1 and compared them with 46 control tumors with no SRSF1 overexpression. We detected 2181 AS events associated with SRSF1 overexpression, reproducible in ≥5 tumors (Figure 5, Table S7). In agreement with our regulatory model, we observed a larger proportion of exon inclusion, as opposed to skipping, in CA-exons. This tendency was stronger for the subset of highly reproducible AS events, and weaker for CA-exons with reproducibility below 3 tumors (Figure 5, Table S7).
Figure 5. Splicing changes in SRSF1-OE human breast tumors from TCGA.
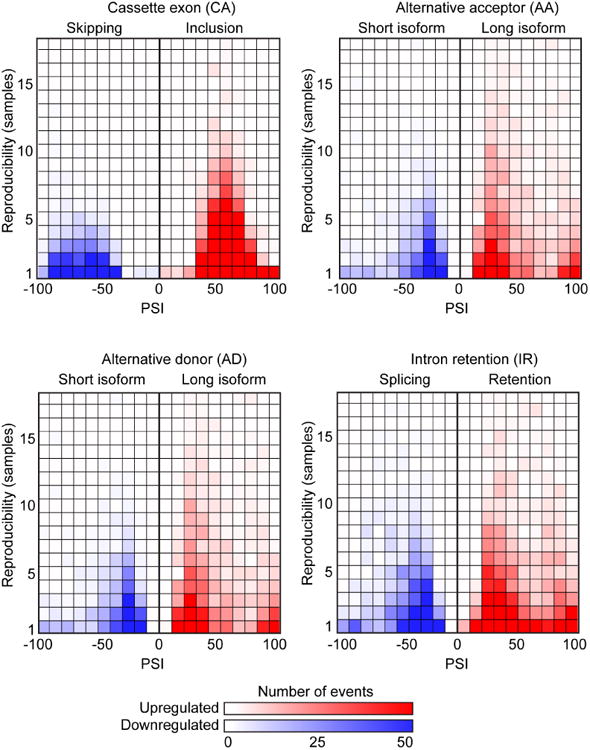
PSI in SRSF1-OE tumors is indicated for CA, AA, AD and IR events, divided into upregulated (red boxes) or downregulated (blue boxes) AS events. The shading of boxes is proportional to the number of events detected in each category. Each vertical axis indicates the number of tumors in which the AS event is detected.
A total of 108 distinct AS events were detected both in our study and in TCGA data with reproducibility ranging from 1 to 12 tumors (Table S7). Three CA-exons (CASC4, EXO1, and ZNF383) and two AA events (MEIS2 and P4HA2) were especially interesting, because they were detected in 7 tumors with overexpression of SRSF1, but not of the remaining 11 SR proteins. This expression pattern suggests that these AS events are more likely to be specifically associated with splicing activation by SRSF1 (Table S7). Moreover, we detected 20 AS events in SRSF1-OE human breast tumors associated with specific clinical features, such as tumor type, tumor stage, or ER and PR status (Table S7). The significance of these AS events as potential tumor biomarkers will require further validation.
We focused on CASC4 splicing, as it was detected in 9 SRSF1-OE tumors, 7 of which overexpressed no other SR proteins (Figure 6A,B and Table S7). CASC4 was alternatively spliced in SRSF1-OE MCF-10A 3-D and 2-D cells (Figure 2A, Table S2), and we also detected it in the following independent datasets comparing: (i) AS changes between 21 normal and 26 malignant human breast samples (Venables et al., 2008) (Table S7); (ii) AS changes in primary murine mammary tumors with different metastatic capabilities (Dutertre et al., 2010); and (iii) laser-captured-microdissected human invasive breast tumors and surrounding normal tissues (Knudsen et al., 2012). SRSF1 overexpression promoted the inclusion of the 168-nt long CASC4 exon 9 (Figure 6C), which encodes a longer protein isoform comprising 56 unique amino acids in the C-terminal region, and predicted to have several phosphorylation and myristoylation sites (Figure 6D). CASC4 exon 9 comprises a cluster of SRSF1 motifs towards the 3′ SS (Figure 6E), in a region that overlaps with a CLIP-tag reported in two independent studies (Pandit et al., 2013; Sanford et al., 2008). CASC4 (cancer susceptibility candidate 4) encodes a transmembrane protein predicted to localize to the Golgi apparatus, although its function remains unclear.
Figure 6. SRSF1 regulates CASC4 alternative splicing in human breast tumors.
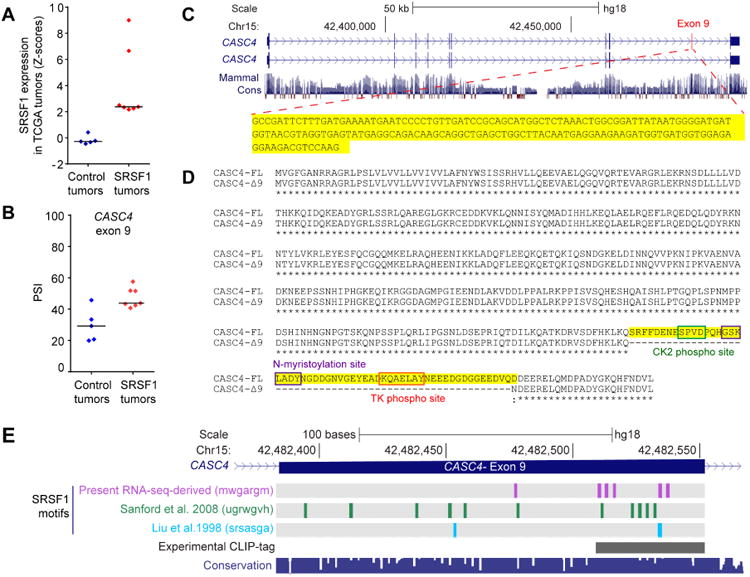
(A) SRSF1 expression levels in human breast tumors from the control and SRFS1-OE groups. (B) PSI scores of SRSF1-regulated CASC4 exon 9 in tumors from (A). (C) Structure of the CASC4 human gene and sequence of exon 9. (D) Sequence of CASC4 protein isoforms. The amino acids encoded by the exon 9 are highlighted in yellow. Post-translational modification sites predicted by Prosite are indicated. (E) Position of SRSF1 motifs and CLIP tags (Sanford et al. 2008, Pandit et al. 2013) in CASC4 exon 9. The 100 Vertebrate Multiz Alignment & Conservation track is shown below.
To begin characterizing the role of CASC4 isoforms in SRSF1-induced transformation, we stably overexpressed CASC4-FL cDNA in MCF-10A cells, to mimic the upregulation observed in SRSF1-OE cells (Figure 7A). In parallel, CASC4-Δ9 cDNA was overexpressed in SRSF1-OE cells, thus reducing the relative proportion of the CASC4-FL isoform (Figure 7A). We then assessed changes in acinar morphology in cells expressing these CASC4 isoforms, and compared them to SRSF1-OE cells. We previously demonstrated that SRSF1-OE acini are larger than control acini, and exhibit increased proliferation and decreased apoptosis (Anczukow et al. 2012). Interestingly, CASC4-FL overexpression increased acinar size (Figure 7B,C), partially mimicking the effect of SRSF1 overexpression. In addition, acini overexpressing CASC4-FL exhibited increased proliferation (Figure 7D), as well as decreased apoptosis (Figure 7E), compared to control acini. Overexpression of CASC4-Δ9 had a limited effect on SRSF1-OE acini, promoting a very mild decrease in proliferation, but no changes in acinar size or apoptosis. This observation suggests that CASC4-FL upregulation, but not CASC4-Δ9 downregulation, contributes to the SRSF1-induced acinar phenotype. In the future, it will be of interest to further define the functions of CASC4 isoforms in normal and cancer cells.
Figure 7. The CASC4-FL isoform partially recapitulates the SRSF1-mediated acinar phenotype.
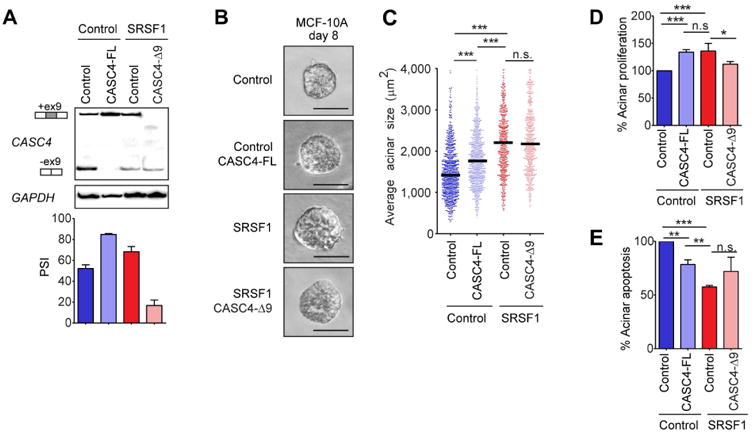
(A) RT-PCR analysis of CASC4 isoforms in control MCF-10A cells overexpressing the control (empty vector) or CASC4-FL cDNA, as well as in SRSF1-OE MCF-10A cells together with the control (empty vector) or CASC4-Δ9 cDNA. PSI was quantified for each condition (n=3). Error bars, s.d. (B) Phase-contrast pictures of control and SRSF1-OE day-8 acini, expressing the control, CASC4-FL or CASC4-Δ9 constructs. Scale bar: 50 μm. (C) Acinar size distribution and median size (n=3, >100 acini per experiment; Mann-Whitney test *** P<0.0005). (D,E). The percent of day-8 acini positive for the proliferation marker ki67 (D) or the apoptosis marker cleaved caspase-3 (E) is plotted, normalized to control acini (n≥3, >30 acini per experiment; Fisher test *** P<0.0005, ** P<0.005, * P<0.05). Error bars, s.d.
Discussion
Endogenous SRSF1 targets with relevance to breast cancer
The splicing factor SRSF1 is often overexpressed in human breast tumors, but its targets are still poorly characterized. Here we used RNA-seq to identify SRSF1-regulated AS events in a model that mimics a disease-relevant cellular context. We used SpliceTrap/SpliceDuo to detect and quantify AS changes in RNA-seq data. RNA-seq allows genome-wide interrogation of RNA splicing patterns across multiple conditions, and extensive datasets are rapidly accumulating. However, detecting exon-centric AS events is not the same as gene-expression or whole-transcript reconstruction analyses, and requires specialized bioinformatics tools. SpliceTrap/SpliceDuo addresses many of the challenges in AS quantification, such as quantification of PSI scores of specific exons in mRNA populations, quantification of relative splicing changes between such populations, and assignment of statistical significance to such variations. Using a gene candidate approach, we previously identified changes in RON, BIN1 and MKNK2 splicing in SRSF1-OE MCF-10A cells (Anczukow et al. 2012). These AS events were not observed in our RNA-seq experiments, although they were detected among several of the 57 SRSF1-OE tumor samples (Table S7). They were not statistically significant in our dataset, due to coverage or other thresholds; however, lowering the thresholds to include these three AS events would introduce many false positives. In general, we believe that the sensitivity of RNA-seq data is far from saturated, at least for AS analysis. This is evident in the limited overlap seen across datasets from previous papers (Pandit et al., 2013; Sanford et al., 2008; Sanford et al., 2009). Using a large number of replicates, as in the case of TCGA data, may be a way to increase sensitivity. We validated by RT-PCR over 100 endogenous SRFS1-regulated AS events, and have thus greatly expanded the repertoire of known SRSF1 targets. We identified these SRSF1-regulated AS targets in a non-transformed mammary epithelial cell line under slight overexpression conditions, comparable to the SRSF1 levels observed in many human tumors, and these targets are thus likely to be relevant to human breast cancer. Many of the SRSF1 AS targets are involved in gene-expression regulation, cell-cycle and proliferation control, as well as cell death and survival, consistent with the previously described roles of SRSF1 in genomic stability, cell viability, and cell-cycle progression (Das and Krainer, 2014). Interestingly, we uncovered differential, and sometimes even opposite, splicing patterns between cells grown in 3-D and 2-D, underlying the importance of culture conditions for identifying biologically meaningful AS changes.
MCF-10A cells represent a unique model of mammary gland morphogenesis, and form organized and polarized structures in 3-D culture and recapitulate more closely the biological context in which tumors arise (Debnath and Brugge, 2005). Thus we expect that some of the differential AS changes detected in 3-D vs 2-D grown MCF-10A cells are associated with these changes in cell polarity and cell signaling. HeLa cells can also be grown in 3-D culture, but they are unable to form organized or polarized structures (Zhao et al., 2014). HeLa cells have accumulated multiple genomic alterations since originally cultured, so it is unclear how relevant they are as a cancer model. Thus, we only used HeLa cells as a way of comparing the SRSF1 targets detected with our bioinformatics pipeline to known SRSF1 targets previously characterized in HeLa cells.
To identify SRSF1-regulated AS events involved in SRSF1's oncogenic activity, we interrogated a collection of SRSF1-OE human breast tumors. We identified several AS events regulated by SRSF1 in 3-D and 2-D MCF-10A cultures, as well as in tumors. The relatively small overlap in SRSF1-regulated splicing events detected in MCF-10A and in human tumors implies that other splicing factors are involved in alternative splicing regulation in these tumors, or that these splicing events are only regulated in the early stages of carcinogenesis. Of particular interest, SRSF1 promoted inclusion of CASC4 exon 9, which contains several SRSF1 motifs overlapping with CLIP-tags. Skipping of this exon results in a shorter protein isoform lacking 56 amino acids. CASC4 was initially identified as a gene upregulated in a cell line overexpressing HER-2/Neu (Oh et al., 1999). However, we did not observe a correlation between HER-2 and CASC4 levels in a collection of 958 human breast tumors (data not shown). Interestingly, we previously showed that SRSF1 does not cooperate with ERBB2 in transformation of MCF-10A cells (Anczukow et al., 2012), raising the possibility that they affect common oncogenic targets or pathways. Furthermore, we also detected consistent changes in CASC4 splicing in several independent datasets comparing AS in breast tumors to normal tissue, consistent with a potential role of CASC4 in breast cancer. By overexpressing either the CASC4-FL or CASC4-Δ9 isoforms, we demonstrate that upregulation of the CASC4-FL isoform contributes to the SRSF1-mediated increase in acinar size and proliferation. Thus we provide the first functional evidence of the role of CASC4 in mammary epithelial cell transformation. Further studies to understand in more detail the functions of CASC4 isoforms in normal and transformed cells, and their contribution to disease progression are clearly warranted.
Alternative splicing activation and exon definition by SRSF1
Using the RNA-seq data, we derived an SRFS1 binding consensus. This motif was predicted from reproducible splicing changes associated with SRSF1, trained with MEME, RSAT and in-house methods, and tested with independent data. The RNA-seq-derived motif resembles older versions derived from SELEX and other binding experiments, even though the previous motifs do not always agree with each other (Pandit et al., 2013; Ray et al., 2013; Sanford et al., 2008; Sanford et al., 2009; Smith et al., 2006; Tacke and Manley, 1995).
Consensus motifs are abstract representations and are prone to reflect characteristics of the techniques used to gather data and the tools selected for the analysis. The published SRSF1 motifs do agree in many respects, such as the general preference for purines or the occurrence of AGGA in the consensus (Pandit et al., 2013; Ray et al., 2013; Sanford et al., 2009; Smith et al., 2006; Tacke and Manley, 1995). The RNA-seq-derived motif is strongly supported by in vitro binding assays, which are consistent with the published RRM structures and RNA-recognition mode (Clery et al., 2013).
SRSF1 is the founding member of the SR protein family of splicing activators (Das and Krainer, 2014). However, recent studies suggested that SRSF1 can also act as a splicing repressor (Ghigna et al., 2005; Pandit et al., 2013). Our RNA-seq data show, as in a previous study (Pandit et al., 2013), similar proportions of exon inclusion and skipping. This might represent a mixture of direct and indirect AS changes promoted by SRSF1. Our results suggest that SRSF1 preferentially acts directly as a splicing activator, based on two lines of evidence: first, the relatively large proportion of reproducible CA-exon inclusion events detected in SRSF1-OE TCGA tumors (Figure 5, Table S7); and second, the enrichment of SRSF1 binding motifs near the 5′ SS of up-regulated CA-exons.
Previous genome-wide studies uncovered positional effects of splicing regulators, such as RBFOX, NOVA, PTB, MBNL and hnRNPs (Witten and Ule, 2011). Characterization of SR protein binding patterns had been inconclusive in defining relationships between positional and functional outcomes (Pandit et al., 2013). Here, using Bayesian inference, we successfully captured positional signals in exons regulated by SRSF1. This approach did not require sequence-size normalization and “moving-averages” smoothing, which can complicate comparisons across exonic sequences of different sizes. In addition, we detected an inverse relationship between SS strength and the number of SRSF1 motifs near the 3′SS in both skipped and included exons. This relationship may reflect the role of SRSF1 in constitutive exon definition, and is in agreement with a study showing that SRSF1 directly binds to members of the U2 snRNP sub-complex SF3, which participates in branch point recognition (Akerman et al., 2015). Finally, based on our evaluation of co-regulation with other SR proteins (Figure 4), we propose that SRSF1 preferentially exerts splicing activation by directly binding to the pre-mRNA targets, whereas splicing repression most likely reflects a mixture of direct binding and indirect interactions involving other regulators. In summary, we defined rules for splicing activation and repression by SRSF1, and identified SRSF1-regulated AS events that are candidates for mediating SRSF1's oncogenic functions in mammary cells.
Experimental Procedures
Plasmids
cDNA for CASC4-FL and CASC4-Δ9 isoforms were synthesized (Genescript) and subcloned into a pBABE-Puro vector.
Cell culture and cell lines
MCF-10A and HeLa cells expressing wild-type SRSF1 were generated as described (Anczukow et al., 2012; Fregoso et al., 2013). Populations of cells expressing control empty vector, CASC4-FL or CASC4-Δ9, were generated by retroviral transduction and puromycin selection (2 μg ml-1).
Three-dimensional assays
See Supplemental Experimental Procedures.
Western blot analysis
See Supplemental Experimental Procedures.
RNA-sequencing
See Supplemental Experimental Procedures.
Analysis of splicing changes in cell lines and TCGA tumors
See Supplemental Experimental Procedures.
SpliceDuo
See Supplemental Experimental Procedures.
RT-PCR validation
See Supplemental Experimental Procedures.
Motif discovery and comparison
See Supplemental Experimental Procedures.
NMR titration and isothermal titration calorimetry
See Supplemental Experimental Procedures.
Minigene reporter assays
See Supplemental Experimental Procedures.
Regulatory maps
See Supplemental Experimental Procedures.
Analysis of expression changes
SRSF1-induced expression changes were determined using DEseq on read count RNA-seq data, as described (Anders and Huber, 2010).
Splice-site-strength analysis
Splice-site strength was calculated using MaxEnt (Yeo and Burge, 2004).
Pathway-enrichment analysis
Pathway-enrichment analysis was performed using Ingenuity Pathway Analysis 5.0 (Ingenuity).
Supplementary Material
Highlights.
Developed a tool for splicing detection and quantification in RNA-seq data
Identified and validated hundreds of endogenous SRSF1-regulated splicing targets
Defined regulatory maps to predict the positional effects of SRSF1 binding
Identified oncogenic SRSF1-regulated splicing targets in human tumors
Acknowledgments
We thank Chaolin Zhang for comments on the manuscript. We acknowledge assistance from the CSHL Microscopy and Sequencing Shared Resources, funded in part by NCI Cancer Center Support Grant 5P30CA045508. This work was supported by grants from the NCI (grants CA13106 to A.R.K. and CA178206 to O.A.), from the NCCR RNA and Disease of the SNSF (to F.H.-T.A. and A.C.), postdoctoral awards to O.A. from the Susan B. Komen Foundation for the Cure (grant KG091029) and the Terri Brodeur Breast Cancer Foundation (grant 66810101). We acknowledge the use of data generated by TCGA, managed by NCI and NHGRI.
Footnotes
Accession Numbers: The accession number for sequencing data is SRP062609.
Author Contributions: A.C. performed the NMR and ITC experiments, and O.A. conducted all the other experiments. M.A. and J.W. optimized SpliceTrap. M.A. developed SpliceDuo, the Bayesian maps, and performed the computational analysis. C.S. and N.H.S. contributed to the PCR analysis. A.R. contributed to SpliceDuo optimization. S.S. performed the HeLa RNA-seq. M.A.J. provided the inducible HeLa cells. Y.H. constructed the SMN2 minigene. O.A., M.A. and A.R.K. designed the study, analyzed the data, and wrote the paper. All authors discussed the results and commented on the manuscript.
Competing Financial Interests: M.A. is a founder and shareholder of Envisagenics, Inc., and A.R.K is a member of its scientific advisory board.
Publisher's Disclaimer: This is a PDF file of an unedited manuscript that has been accepted for publication. As a service to our customers we are providing this early version of the manuscript. The manuscript will undergo copyediting, typesetting, and review of the resulting proof before it is published in its final citable form. Please note that during the production process errors may be discovered which could affect the content, and all legal disclaimers that apply to the journal pertain.
References
- Akerman M, Fregoso OI, Das S, Ruse C, Jensen MA, Pappin DJ, Zhang MQ, Krainer AR. Differential connectivity of splicing activators and repressors to the human spliceosome. Genome Biol. 2015;16:119. doi: 10.1186/s13059-015-0682-5. [DOI] [PMC free article] [PubMed] [Google Scholar]
- Anczuków O, Rosenberg AZ, Akerman M, Das S, Zhan L, Karni R, Muthuswamy SK, Krainer AR. The splicing factor SRSF1 regulates apoptosis and proliferation to promote mammary epithelial cell transformation. Nat Struct Mol Biol. 2012;19:220–228. doi: 10.1038/nsmb.2207. [DOI] [PMC free article] [PubMed] [Google Scholar]
- Anders S, Huber W. Differential expression analysis for sequence count data. Genome Biol. 2010;11:R106. doi: 10.1186/gb-2010-11-10-r106. [DOI] [PMC free article] [PubMed] [Google Scholar]
- Bissell MJ, Kenny PA, Radisky DC. Microenvironmental regulators of tissue structure and function also regulate tumor induction and progression: the role of extracellular matrix and its degrading enzymes. Cold Spring Harbor Symp Quant Biol. 2005;70:343–356. doi: 10.1101/sqb.2005.70.013. [DOI] [PMC free article] [PubMed] [Google Scholar]
- Black DL. Mechanisms of alternative pre-messenger RNA splicing. Annu Rev Biochem. 2003;72:291–336. doi: 10.1146/annurev.biochem.72.121801.161720. [DOI] [PubMed] [Google Scholar]
- Blanchette M, Green RE, Brenner SE, Rio DC. Global analysis of positive and negative pre-mRNA splicing regulators in Drosophila. Genes Dev. 2005;19:1306–1314. doi: 10.1101/gad.1314205. [DOI] [PMC free article] [PubMed] [Google Scholar]
- Cáceres JF, Stamm S, Helfman DM, Krainer AR. Regulation of alternative splicing in vivo by overexpression of antagonistic splicing factors. Science. 1994;265:1706–1709. doi: 10.1126/science.8085156. [DOI] [PubMed] [Google Scholar]
- Cartegni L, Krainer AR. Disruption of an SF2/ASF-dependent exonic splicing enhancer in SMN2 causes spinal muscular atrophy in the absence of SMN1. Nature Genet. 2002;30:377–384. doi: 10.1038/ng854. [DOI] [PubMed] [Google Scholar]
- Cartegni L, Wang J, Zhu Z, Zhang MQ, Krainer AR. ESEfinder: A web resource to identify exonic splicing enhancers. Nucleic Acids Res. 2003;31:3568–3571. doi: 10.1093/nar/gkg616. [DOI] [PMC free article] [PubMed] [Google Scholar]
- Cléry A, Sinha R, Anczuków O, Corrionero A, Moursy A, Daubner GM, Valcárcel J, Krainer AR, Allain FH. Isolated pseudo-RNA-recognition motifs of SR proteins can regulate splicing using a noncanonical mode of RNA recognition. Proc Natl Acad Sciences USA. 2013;110:E2802–2811. doi: 10.1073/pnas.1303445110. [DOI] [PMC free article] [PubMed] [Google Scholar]
- Das S, Krainer AR. Emerging functions of SRSF1, splicing factor and oncoprotein, in RNA metabolism and cancer. Mol Cancer Res. 2014;12:1195–1204. doi: 10.1158/1541-7786.MCR-14-0131. [DOI] [PMC free article] [PubMed] [Google Scholar]
- Debnath J, Brugge JS. Modelling glandular epithelial cancers in three-dimensional cultures. Nature Rev Cancer. 2005;5:675–688. doi: 10.1038/nrc1695. [DOI] [PubMed] [Google Scholar]
- Dutertre M, Lacroix-Triki M, Driouch K, de la Grange P, Gratadou L, Beck S, Millevoi S, Tazi J, Lidereau R, Vagner S, et al. Exon-based clustering of murine breast tumor transcriptomes reveals alternative exons whose expression is associated with metastasis. Cancer Res. 2010;70:896–905. doi: 10.1158/0008-5472.CAN-09-2703. [DOI] [PubMed] [Google Scholar]
- Fregoso OI, Das S, Akerman M, Krainer AR. Splicing-factor oncoprotein SRSF1 stabilizes p53 via RPL5 and induces cellular senescence. Mol Cell. 2013;50:56–66. doi: 10.1016/j.molcel.2013.02.001. [DOI] [PMC free article] [PubMed] [Google Scholar]
- Ghigna C, Giordano S, Shen H, Benvenuto F, Castiglioni F, Comoglio PM, Green MR, Riva S, Biamonti G. Cell motility is controlled by SF2/ASF through alternative splicing of the Ron protooncogene. Mol Cell. 2005;20:881–890. doi: 10.1016/j.molcel.2005.10.026. [DOI] [PubMed] [Google Scholar]
- Goren A, Ram O, Amit M, Keren H, Lev-Maor G, Vig I, Pupko T, Ast G. Comparative analysis identifies exonic splicing regulatory sequences--The complex definition of enhancers and silencers. Mol Cell. 2006;22:769–781. doi: 10.1016/j.molcel.2006.05.008. [DOI] [PubMed] [Google Scholar]
- Huelga SC, Vu AQ, Arnold JD, Liang TY, Liu PP, Yan BY, Donohue JP, Shiue L, Hoon S, Brenner S, et al. Integrative genome-wide analysis reveals cooperative regulation of alternative splicing by hnRNP proteins. Cell Rep. 2012;1:167–178. doi: 10.1016/j.celrep.2012.02.001. [DOI] [PMC free article] [PubMed] [Google Scholar]
- Karni R, de Stanchina E, Lowe SW, Sinha R, Mu D, Krainer AR. The gene encoding the splicing factor SF2/ASF is a proto-oncogene. Nat Struct Mol Biol. 2007;14:185–193. doi: 10.1038/nsmb1209. [DOI] [PMC free article] [PubMed] [Google Scholar]
- Knudsen ES, Ertel A, Davicioni E, Kline J, Schwartz GF, Witkiewicz AK. Progression of ductal carcinoma in situ to invasive breast cancer is associated with gene expression programs of EMT and myoepithelia. Breast Cancer Res Treat. 2012;133:1009–1024. doi: 10.1007/s10549-011-1894-3. [DOI] [PubMed] [Google Scholar]
- Licatalosi DD, Mele A, Fak JJ, Ule J, Kayikci M, Chi SW, Clark TA, Schweitzer AC, Blume JE, Wang X, et al. HITS-CLIP yields genome-wide insights into brain alternative RNA processing. Nature. 2008;456:464–469. doi: 10.1038/nature07488. [DOI] [PMC free article] [PubMed] [Google Scholar]
- Liu HX, Zhang M, Krainer AR. Identification of functional exonic splicing enhancer motifs recognized by individual SR proteins. Genes Dev. 1998;12:1998–2012. doi: 10.1101/gad.12.13.1998. [DOI] [PMC free article] [PubMed] [Google Scholar]
- Long JC, Cáceres JF. The SR protein family of splicing factors: master regulators of gene expression. Biochem J. 2009;417:15–27. doi: 10.1042/BJ20081501. [DOI] [PubMed] [Google Scholar]
- Mayeda A, Zahler AM, Krainer AR, Roth MB. Two members of a conserved family of nuclear phosphoproteins are involved in pre-mRNA splicing. Proc Natl Acad Sci USA. 1992;89:1301–1304. doi: 10.1073/pnas.89.4.1301. [DOI] [PMC free article] [PubMed] [Google Scholar]
- Oh JJ, Grosshans DR, Wong SG, Slamon DJ. Identification of differentially expressed genes associated with HER-2/neu overexpression in human breast cancer cells. Nucleic Acids Res. 1999;27:4008–4017. doi: 10.1093/nar/27.20.4008. [DOI] [PMC free article] [PubMed] [Google Scholar]
- Pandit S, Zhou Y, Shiue L, Coutinho-Mansfield G, Li H, Qiu J, Huang J, Yeo GW, Ares M, Jr, Fu XD. Genome-wide analysis reveals SR protein cooperation and competition in regulated splicing. Mol Cell. 2013;50:223–235. doi: 10.1016/j.molcel.2013.03.001. [DOI] [PMC free article] [PubMed] [Google Scholar]
- Ram O, Ast G. SR proteins: a foot on the exon before the transition from intron to exon definition. Trends Genet. 2007;23:5–7. doi: 10.1016/j.tig.2006.10.002. [DOI] [PubMed] [Google Scholar]
- Ray D, Kazan H, Chan ET, Pena Castillo L, Chaudhry S, Talukder S, Blencowe BJ, Morris Q, Hughes TR. Rapid and systematic analysis of the RNA recognition specificities of RNA-binding proteins. Nature Biotechnol. 2009;27:667–670. doi: 10.1038/nbt.1550. [DOI] [PubMed] [Google Scholar]
- Ray D, Kazan H, Cook KB, Weirauch MT, Najafabadi HS, Li X, Gueroussov S, Albu M, Zheng H, Yang A, et al. A compendium of RNA-binding motifs for decoding gene regulation. Nature. 2013;499:172–177. doi: 10.1038/nature12311. [DOI] [PMC free article] [PubMed] [Google Scholar]
- Sanford JR, Coutinho P, Hackett JA, Wang X, Ranahan W, Cáceres JF. Identification of nuclear and cytoplasmic mRNA targets for the shuttling protein SF2/ASF. PLoS One. 2008;3:e3369. doi: 10.1371/journal.pone.0003369. [DOI] [PMC free article] [PubMed] [Google Scholar]
- Sanford JR, Wang X, Mort M, Vanduyn N, Cooper DN, Mooney SD, Edenberg HJ, Liu Y. Splicing factor SFRS1 recognizes a functionally diverse landscape of RNA transcripts. Genome Res. 2009;19:381–394. doi: 10.1101/gr.082503.108. [DOI] [PMC free article] [PubMed] [Google Scholar]
- Schaal TD, Maniatis T. Selection and characterization of pre-mRNA splicing enhancers: identification of novel SR protein-specific enhancer sequences. Mol Cell Biol. 1999;19:1705–1719. doi: 10.1128/mcb.19.3.1705. [DOI] [PMC free article] [PubMed] [Google Scholar]
- Smith PJ, Zhang C, Wang J, Chew SL, Zhang MQ, Krainer AR. An increased specificity score matrix for the prediction of SF2/ASF-specific exonic splicing enhancers. Hum Mol Genet. 2006;15:2490–2508. doi: 10.1093/hmg/ddl171. [DOI] [PubMed] [Google Scholar]
- Srebrow A, Kornblihtt AR. The connection between splicing and cancer. J Cell Sci. 2006;119:2635–2641. doi: 10.1242/jcs.03053. [DOI] [PubMed] [Google Scholar]
- Tacke R, Manley JL. The human splicing factors ASF/SF2 and SC35 possess distinct, functionally significant RNA binding specificities. EMBO J. 1995;14:3540–3551. doi: 10.1002/j.1460-2075.1995.tb07360.x. [DOI] [PMC free article] [PubMed] [Google Scholar]
- Venables JP, Klinck R, Bramard A, Inkel L, Dufresne-Martin G, Koh C, Gervais-Bird J, Lapointe E, Froehlich U, Durand M, et al. Identification of alternative splicing markers for breast cancer. Cancer Res. 2008;68:9525–9531. doi: 10.1158/0008-5472.CAN-08-1769. [DOI] [PubMed] [Google Scholar]
- Visconte V, Makishima H, Maciejewski JP, Tiu RV. Emerging roles of the spliceosomal machinery in myelodysplastic syndromes and other hematological disorders. Leukemia. 2012;26:2447–2454. doi: 10.1038/leu.2012.130. [DOI] [PMC free article] [PubMed] [Google Scholar]
- Wang Z, Murigneux V, Le Hir H. Transcriptome-wide modulation of splicing by the exon junction complex. Genome Biol. 2014;15:551. doi: 10.1186/s13059-014-0551-7. [DOI] [PMC free article] [PubMed] [Google Scholar]
- Whaba G. CBMS-NSF Regional Conference Series in Applied Mathematics. Vol. 59. Society for Industrial and Applied Mathematics; Philadelphia, PA: 1990. Spline Models for Observational Data; p. xvi + 161. [Google Scholar]
- Witten JT, Ule J. Understanding splicing regulation through RNA splicing maps. Trends Genet. 2011;27:89–97. doi: 10.1016/j.tig.2010.12.001. [DOI] [PMC free article] [PubMed] [Google Scholar]
- Wu J, Akerman M, Sun S, McCombie WR, Krainer AR, Zhang MQ. SpliceTrap: a method to quantify alternative splicing under single cellular conditions. Bioinformatics. 2011;27:3010–3016. doi: 10.1093/bioinformatics/btr508. [DOI] [PMC free article] [PubMed] [Google Scholar]
- Yeo G, Burge CB. Maximum entropy modeling of short sequence motifs with applications to RNA splicing signals. J Comput Biol. 2004;11:377–394. doi: 10.1089/1066527041410418. [DOI] [PubMed] [Google Scholar]
- Yoshida K, Ogawa S. Splicing factor mutations and cancer. Wiley Interdiscip Rev RNA. 2014;5:445–459. doi: 10.1002/wrna.1222. [DOI] [PubMed] [Google Scholar]
- Yoshida K, Sanada M, Shiraishi Y, Nowak D, Nagata Y, Yamamoto R, Sato Y, Sato-Otsubo A, Kon A, Nagasaki M, et al. Frequent pathway mutations of splicing machinery in myelodysplasia. Nature. 2011;478:64–69. doi: 10.1038/nature10496. [DOI] [PubMed] [Google Scholar]
- Zhao Y, Yao R, Ouyang L, Ding H, Zhang T, Zhang K, Cheng S, Sun W. Three-dimensional printing of Hela cells for cervical tumor model in vitro. Biofabrication. 2014;6:035001. doi: 10.1088/1758-5082/6/3/035001. [DOI] [PubMed] [Google Scholar]
Associated Data
This section collects any data citations, data availability statements, or supplementary materials included in this article.