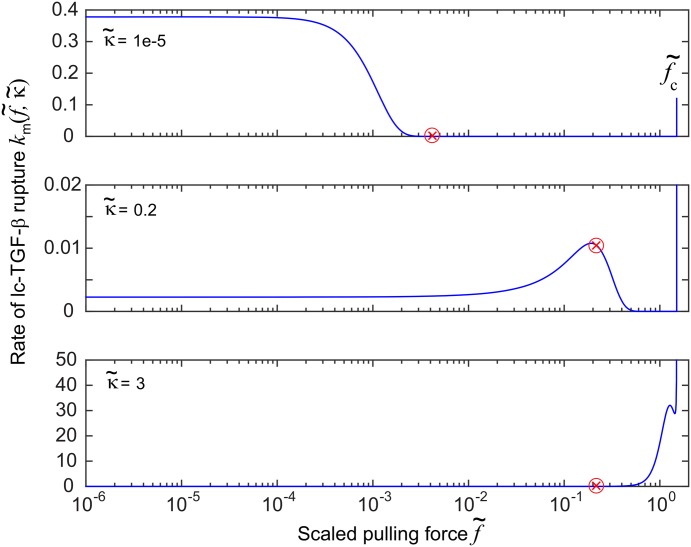
Fig 8. Plot of (in real units of [s−1]) for three different values of scaled substrate stiffness .
The red cross represents the value of the dimensionless scaled force in cell equilibrium, corresponding to the steady state value of α. In the lowest plot (for stiff substrate), the red cross corresponds to a value of k m = 0.01 s−1.

