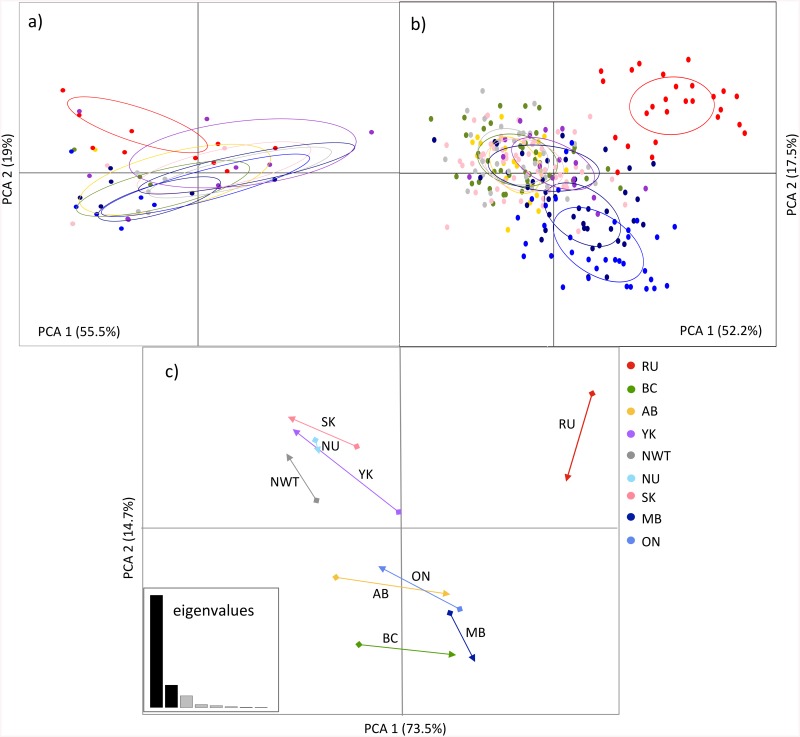
Fig 2. Co-inertia analysis (CoA) between MHC and microsatellite binary-encoded data for nine regions.
Ordination of the first two between-class axes for (a) MHC and (b) microsatellite loci, where dots represent individuals constrained by sampling locations distinguished in different colors; (c) CoA plot, showing the relative position of each population on the factorial plane for the first two CoA eigenvalues and given by the co-variation between MHC and microsatellite data seta. The dots represent the variation observed at microsatellites, while the arrows represent the variation at MHC. The length and direction of the vector denote the translational coefficient of the population position relative to each other, while the strength of the correlation between microsatellite and MHC data sets for each population is inversely correlated with the vector length. Inset figure shows CoA eigenvalues, where each bar represents the proportion of inertia contained for each eigenvalue.

