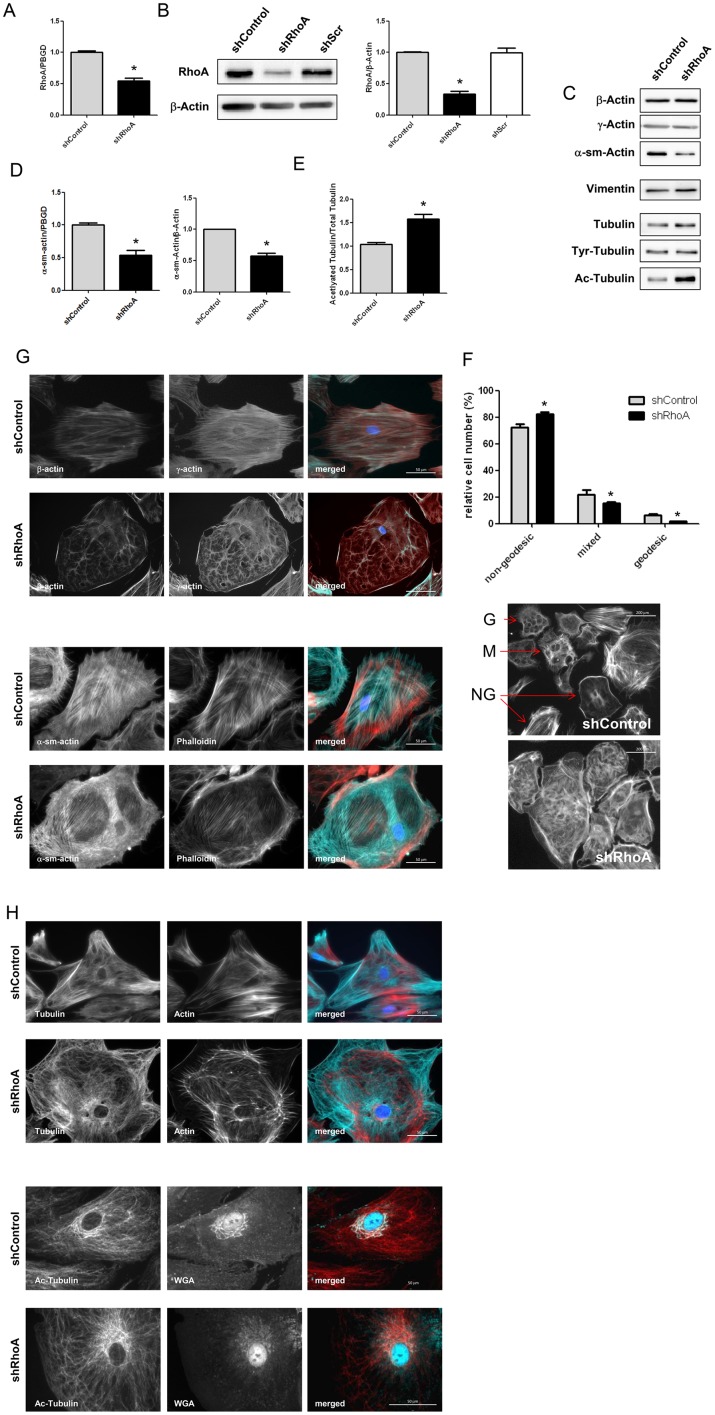
Fig 1. RhoA knockdown influences cytoskeletal protein expression and localization as well as disturbs higher order actin structures.
A) Bar graph summary of real-time PCR data for RhoA in shControl and shRhoA NRCF normalized to PBGD and related to shControl (means ± SEM, n = 6 versus PBGD, *p < 0.05). B) Representative immunoblot of RhoA and β-actin in whole cell lysates from shControl, shScr and shRhoA NRCF (left). Bar graph summary of RhoA protein expression normalized to β-actin (right). The relative change of RhoA in shRhoA NRCF and shScr NRCF to shControl NRCF is given (means ± SEM, n = 22, *p < 0.05). C) Representative immunoblots of investigated cytoskeletal proteins in whole cell lysates from shControl and shRhoA NRCF are shown. D) Bar graph summary of real-time PCR data of α-sm-actin normalized to PBGD and protein expression normalized to β-actin in shControl and shRhoA NRCF relative to shControl (means ± SEM, n = 7, *p < 0.05). E) Bar graph summary of acetylated tubulin normalized to β-actin. Whole cell lysates obtained from shControl and shRhoA NRCF were used. The values are given relative to shControl (means ± SEM, n = 7–12, *p < 0.05). F) Immunofluorescence staining of shControl and shRhoA NRCF for actin isoforms β- (green), γ-actin (red) and DAPI (blue) (320x, upper two rows) or for α-sm-actin (green), actin (red) and DAPI (blue) (lower two rows). G) Analysis of geodesic actin structures (left) and representative immunofluorescence staining of actin structures in shControl and shRhoA NRCF (right). The relative number of geodesic (G), mixed (M) and non-geodesic (NG) NRCF as indicated (arrow) in shControl compared to shRhoA is given (means ± SEM, n = 3, *p < 0.05). H) Immunofluorescence staining of tubulin (green), actin (red) and DAPI (blue) (400x, upper two rows) or acetylated tubulin (red), Golgi apparatus (green) and DAPI (blue) (400x, lower two rows) in shControl and shRhoA NRCF.

