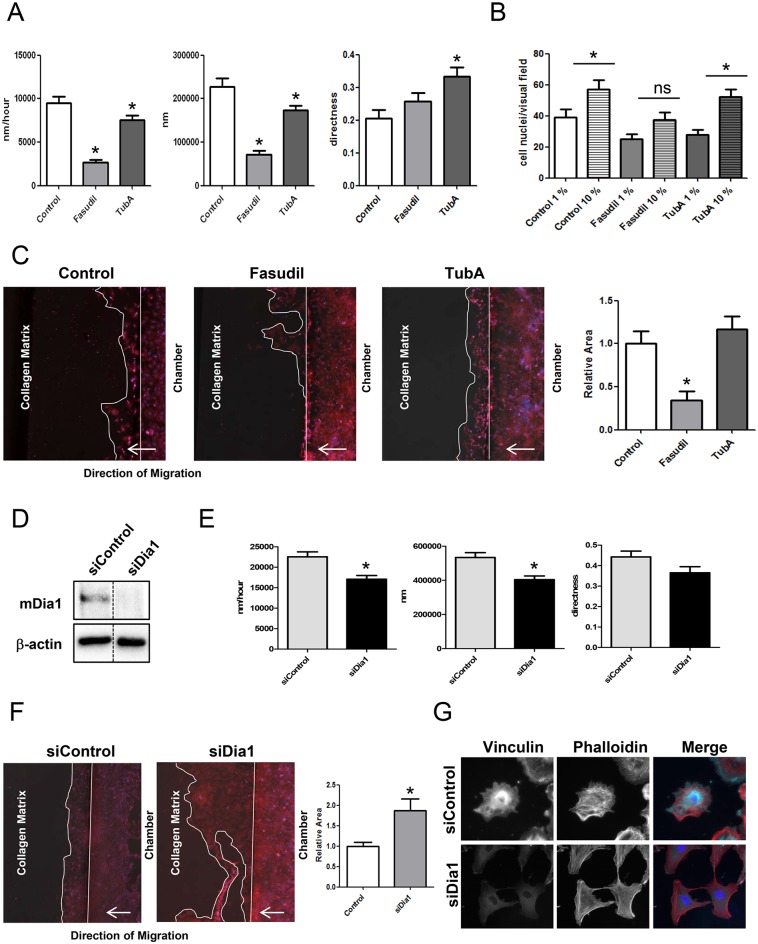
Fig 8. Migration through a collagen matrix is impaired after ROCK inhibition but improved after mDia1 knockdown.
A) Bar graph summary of average migration velocity (left), absolute distance (middle) and directness (right) of control, fasudil and TubA treated NRCF migrating on a plane cell culture surface (means ± SEM, n = 3, 15 NRCF per condition, *p < 0.05). B) Bar graph summary of cell migration of control, fasudil and TubA treated NRCF through a porous membrane (pore size: 8 μm) in the presence of low serum (1%) and high serum (10%) (means ± SEM, n = 4, *p < 0.05). C) Representative images of control, fasudil and TubA treated NRCF migrating through a collagen membrane in ibidi μ-slides3D. The cells were stained for total actin and with DAPI (left). Bar graph summary of cell migration of control, fasudil and TubA treated NRCF through a collagen matrix (1,5% in DMEM) in ibidi μ-slides3D. As a bait FCS (10%) was used (means ± SEM, n = 8, *p < 0.05) (right). D) Representative immunoblot of mDia1 and β-actin in whole cell lysates from shControl and siDia1 NRCF (left). E) Bar graph summary of average migration velocity (left), absolute distance (middle) and directness (right) of siControl and siDia1 NRCF migrating on a plane cell culture surface (means ± SEM, n = 3, 15 NRCF per condition, *p < 0.05). F) Representative images of siControl and siDia1 NRCF migrating through a collagen membrane in ibidi μ-slides3D. The cells were stained for total actin and with DAPI (left). Bar graph summary of cell migration of siControl and siDia1 NRCF through a collagen matrix (1,5% in DMEM) in ibidi μ-slides3D. As a bait FCS (10%) was used (means ± SEM, n = 7, *p < 0.05) (middle). G) Immunofluorescence staining of vinculin (green), actin (red) and DAPI (blue) (320x) of siControl and siDia1 NRCF inside a collagen matrix (1,5% in DMEM) (right).

