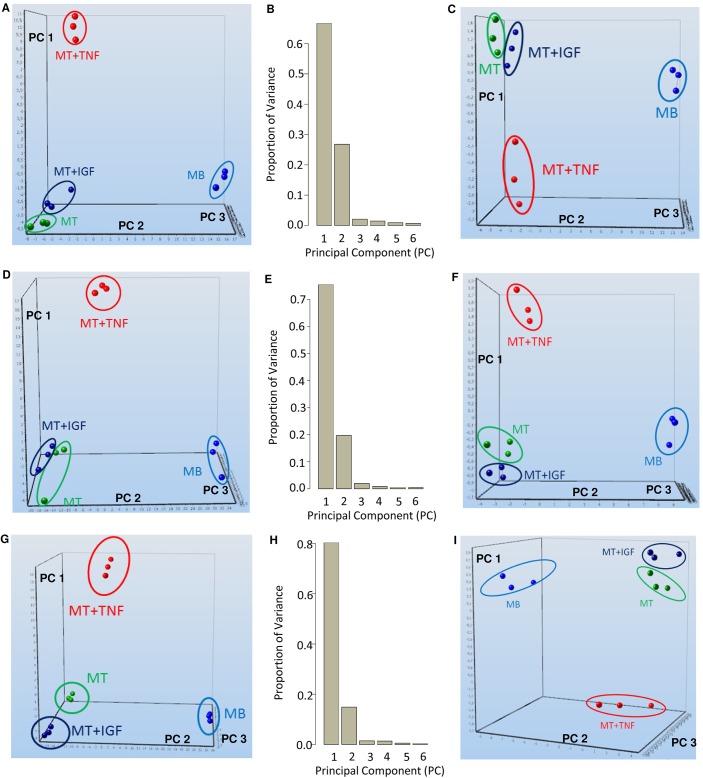
Fig 2. Transcriptomic signatures of myoblast differentiation and TNF-α or IGF1 treatment.
Principal component analyses (PCA) of mRNA expression profiling data after (A) 4 h, (D) 12 h, or (G) 24 h of induction of differentiation with TNF-α, IGF1, or control treatment showing nonambiguous genes are depicted. Axes show principal components (PC) 1, PC 2, and PC 3. PCA revealed separation of treatment groups. Light blue indicates myoblasts, green marks myotubes, red distinguishes myotubes treated with TNF-α, whereas dark blue indicates myotubes treated with IGF1. The proportions of variance for the first six components of principal component analysis are depicted for the effect of (B) 4 h, (E) 12 h, and (H) 24 h after induction of differentiation and the respective treatments. Most of the variance is described by PC 1 followed by PC 2 and PC 3. PC 1 explaines most of the variance of myocyte differentiation while PC 2 represented most of the variance induced by TNF-α whereas PC 3 characterized most of the variance caused by IGF1 treatment. Moreover, results from dynamic principal component analyses (dPCA) (group selection myoblasts) are shown for gene expressions (C) 4 h, (F) 12 h, and (I) 24 h after induction of differentiation and treatment. DPCA identified a minimal subset of genes, which could describe the treatment effects (see Table 2) and separate the effects by principal components.

