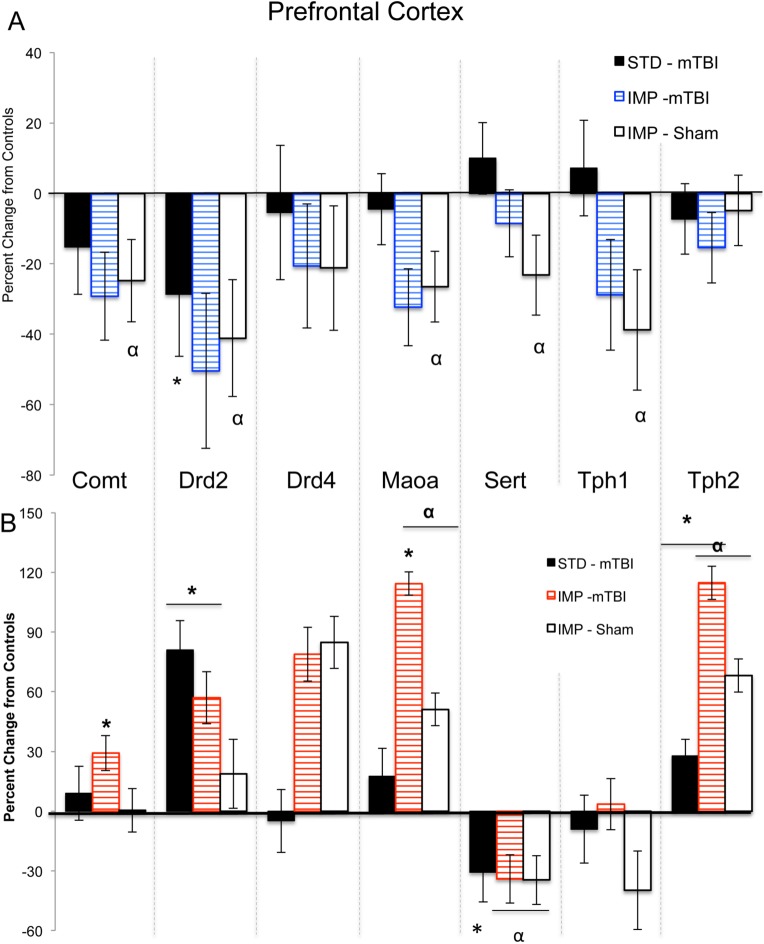
Fig 10. Changes in NAc gene expression for STD animals with a mTBI and IMP animals from both groups.
Males are in the upper panel (A) and females in the lower panel (B). The centerline of each graph represents typical expression (STD-shams) with the bars exhibiting percent changes from normal (*effect of mTBI, α effect of cohort, p < .05).

