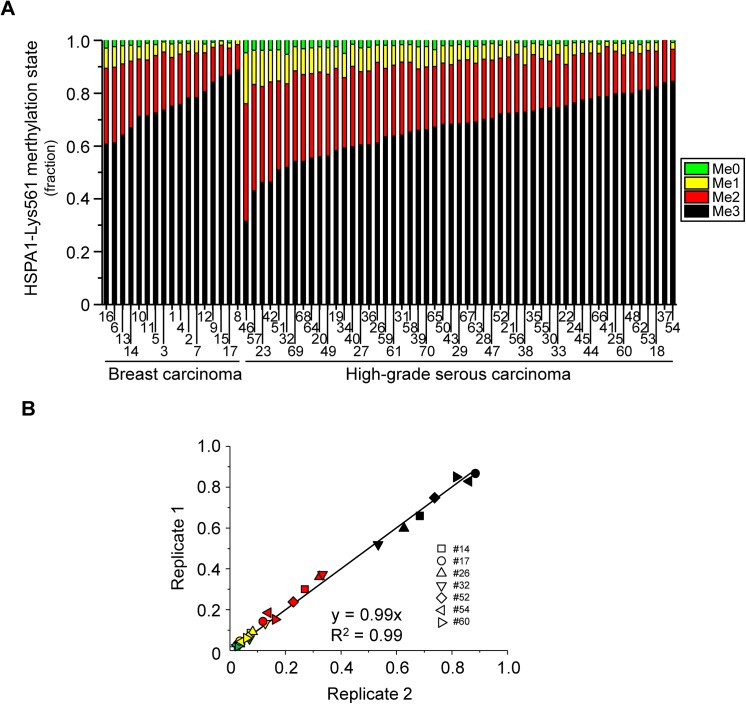
Fig 2. Assessment of HSPA1-Lys561 methylation status in HGSC and breast carcinoma effusions.
(A) Quantitative mass spectrometry analysis of HSPA1-Lys561 methylation. Samples were analyzed as exemplified in Fig 1. The relative abundance of the various methylation states (me0, me1, me2 and me3) of Lys561 in HSPA1 in 17 breast carcinoma (cases # 1–17) and 53 HGSC (cases # 18–70) samples is shown. The data are grouped by cancer type and sorted by increasing relative abundance of me3. (B) Reproducibility of the analysis. A second analysis of 2 randomly chosen breast cancer samples and 5 randomly chosen HGSC samples was performed, and the results were plotted versus the original data set. Data points for the various lysine methylation states are color-coded as in (A) and each tumor sample is represented by a unique geometrical figure.

