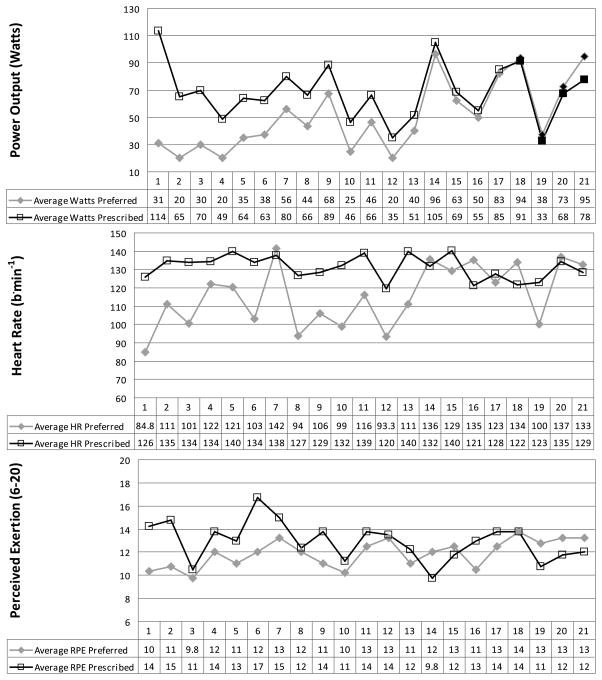
FIGURE 1.
Individual responses for watts, HR, and RPE during the prescribed and preferred exercise conditions. Data plotted on the graph and in the table below each graph represent mean values for the 20-min exercise session. Seventeen of the 21 participants chose a lower wattage for their preferred session compared with the prescribed session. Participants 18 through 21 represent the four individuals who chose a higher wattage for their preferred session compared with the prescribed session. They are denoted on the watts graph (top) by black-filled data points.

