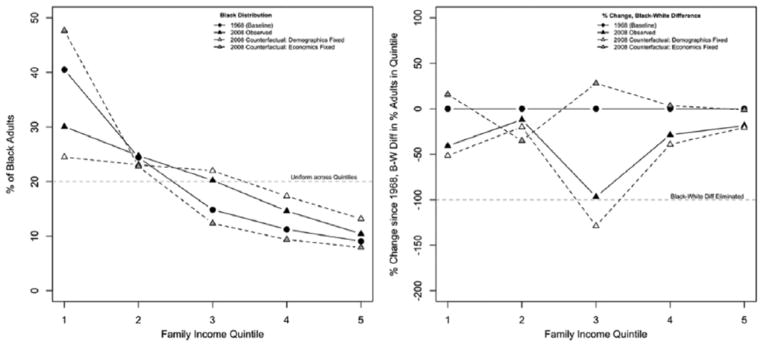
Figure 9.

Observed and Counterfactual Distributions of Adults across Family Income Quintiles
Source: March Current Population Survey data.
Note: Counterfactuals from economic and demographic change models (see text for details). Left panel shows black adults only; right panel shows percent change between 1968 and 2008 in the distributional differences between black and white adults.
