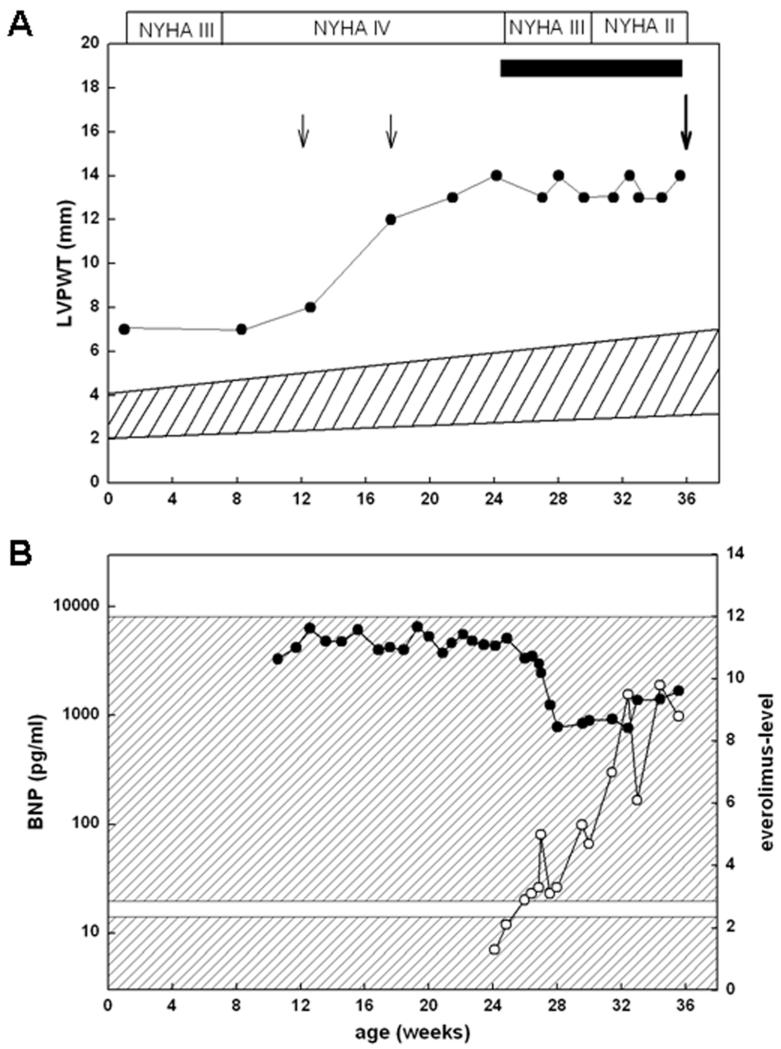
Figure 1.
A: Left ventricular posterior wall thickness (LVPWT) and NYHA stages in relation to age. The black bar indicates the everolimus treatment period, black filled cycles correspond to single LVPWT values, and the hatched area reflects the normal range of LVPWT. Small arrows indicate transcatheter ablations and the large arrow marks the time point when heart transplantion was performed. B: Everolimus (open cycles) and BNP levels (closed cycles) in relation to age. The lower hatched area corresponds to the normal BNP range (<20 pg/ml) and the upper hatched area marks the therapeutic everolimus level range (3-12 μg/ml).

