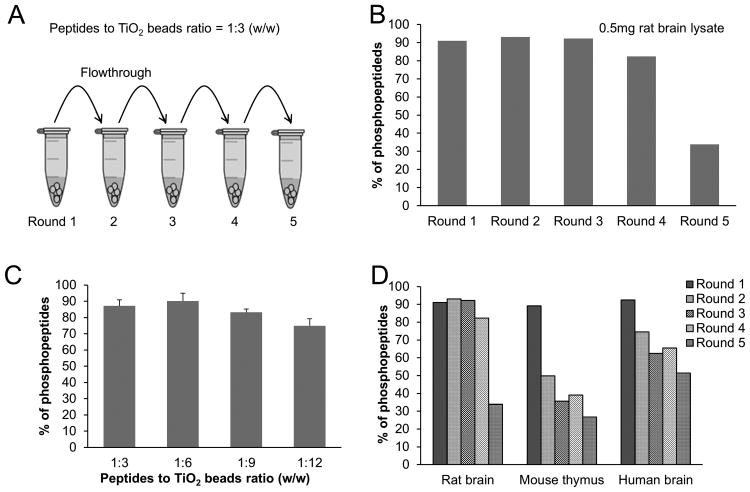
Figure 3.
Effect of peptide-to-bead ratio on the selectivity of phosphopeptide enrichment. The LCMS/MS analysis was repeated with the average of relative standard deviation <10%. (A) Schematic of consecutive phosphopeptide enrichment (peptide-to-bead ratio of 1:3). (B) Percentage of phosphopeptides identified in the five incubations of 0.5 mg rat brain. (C) Percentage of phosphopeptides when different peptide-to-bead ratios were applied. (D) Examining the total level of phosphopeptides in different samples by five consecutive incubations: 0.5 mg of rat brain, mouse thymus and human AD brain, with peptide-to-bead ratio of 1:3.

