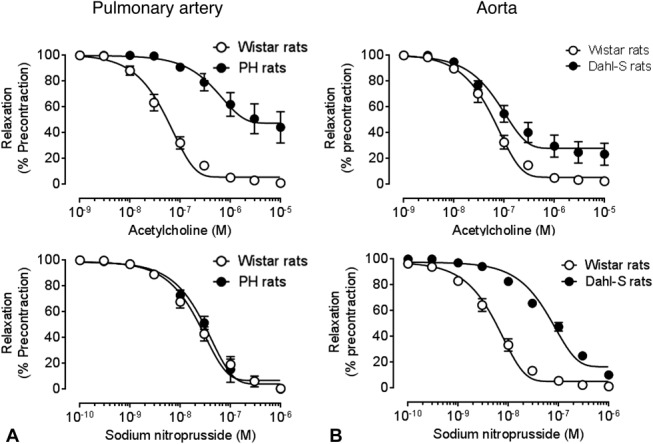
FIGURE 4.

Dose–response curves to acetylcholine (top panel) and nitric oxide donor sodium nitroprusside (bottom panel) in (A) left pulmonary arteries from healthy Wistar rats and diseased monocrotaline (PH) rats (n = 4 per group) and (B) aortas from healthy Wistar rats and diseased Dahl-S rats (n = 6 per group).
