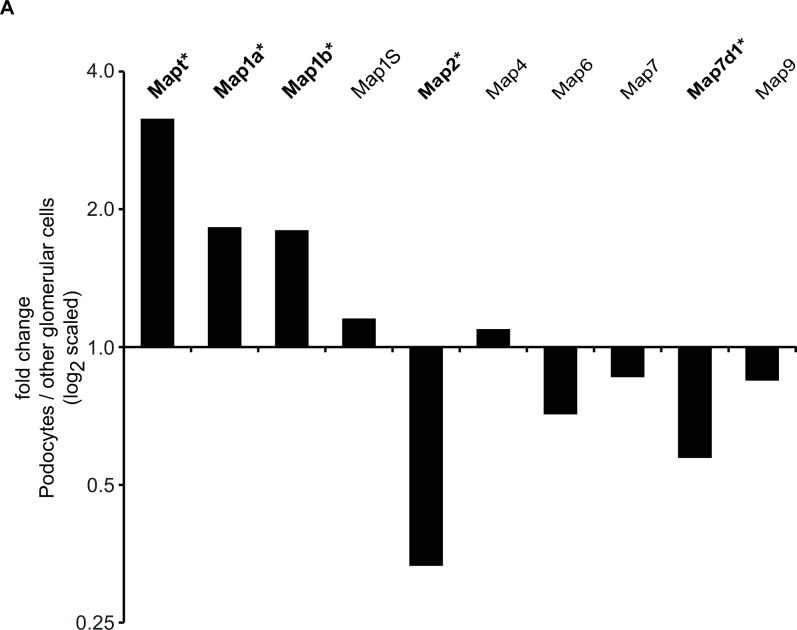
Fig 1. Fold change of Map transcripts in freshly isolated mouse podocytes versus non-podocyte glomerular cells.
Fold change of Map transcripts expression (Affymetrix Mouse Gene 1.0 ST array) of freshly purified mouse podocytes compared to expression non-podocyte glomerular cells. Values > 0 indicate higher expression values in podocyte compared to other glomerular cells (* = significant differential regulation, q-value <0.001)

