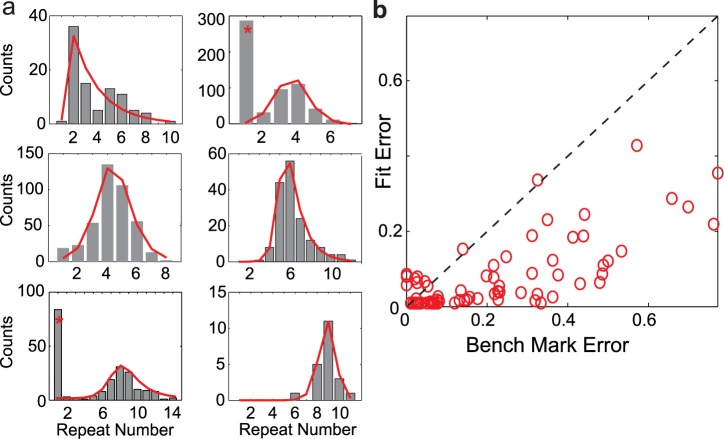
Fig 5. Sigmoidal adaptation model fits diverse repeat number distributions of Bengalese finch songs.
a: Six example Bengalese finch repeat count histograms (grey bars) and the best-fit model distributions (red lines). Peak repeat count increases from left-to-right and down columns. Distribution marked with (*) provide two examples of repeat distributions that have clear double peaks. For these cases, the peaks at repeat number 1 are excluded. b: Scatter plot of fit error vs. benchmark error. Each red circle corresponds to the distribution for one repeated syllable from the song database. The fit errors are smaller than the benchmark errors in the vast majority of cases (86%).

