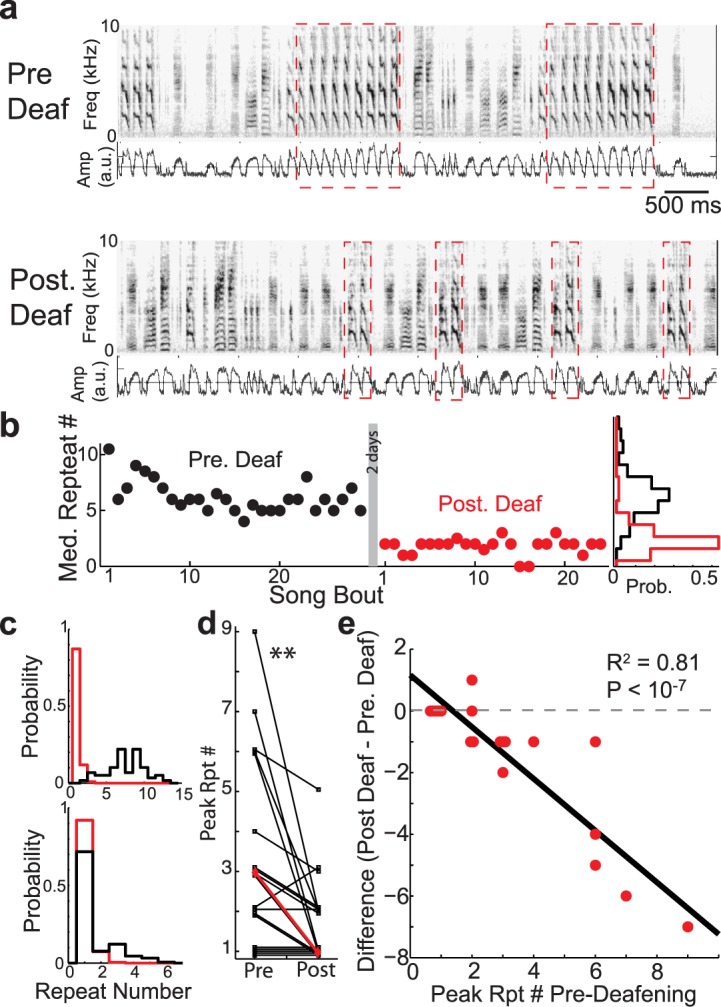
Fig 6. Removal of auditory feedback in Bengalese finches by deafening reduces peak repeat counts.

a: Example spectrograms and rectified amplitude waveforms (blue traces) for the song of one bird before (top) and after (bottom) deafening. Red dashed boxes demarcate the repeated syllables. b: Median repeat counts per song of the syllable from before deafening (black) and after deafening (red). Rotated probability distributions at the right hand side display the repeat counts across all recorded songs before (black) and after (red) deafening. c: Additional examples of repeat distributions pre- (black) and post- (red) deafening. For syllables that were repeated many times, deafening caused sharp reductions in repetitions, resulting in repeat number distributions that are more Markovian (upper graphs). Deafening had less of an effect on syllables that were repeated fewer times (lower graphs). d: Deafening results in a significant decrease in the peak repeat numbers. Individual syllables are in black (overlapping points are vertically shifted for visual clarity), median across syllables is in red. (Wilcoxon sign-rank test, p < 10−2, N = 19). e: Peak repeat numbers before deafening vs. the differences in peak repeat numbers before and after deafening. Red dots correspond to syllables and black line is from linear regression. Larger decreases in peak repeat numbers for syllables that were repeated many times before deafening (R 2 = 0.81, p < 10−7, N = 19).
