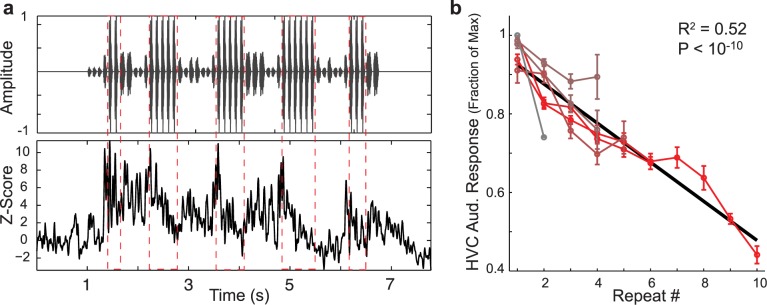
Fig 7. HVC auditory responses to repeated syllables gradually adapt.

a: Example auditory recording from an HVC multi-unit site in response to playback of the BOS (bird’s own song) stimulus. Top panel is the song oscillogram. Bottom plot is the average response rate across trials. Adaptation of HVC auditory responses to a repeated syllable (demarcated by red-dashed lines) is observed. b: Responses to the last syllable in a repeat as a function of the repeat number. Data are presented as mean ± s.e. of normalized auditory responses across sites for a given repeated syllable (11 sites in 4 birds, 6 repeated syllables). Data are colored from grey-to-red with increasing peak repeat number. Across syllables and sites, the response to the last syllable in a repeat declines with increasing repeat number. Black line is from linear regression (R 2 = 0.523, p < 10−10, N = 24, slope = -5%).
