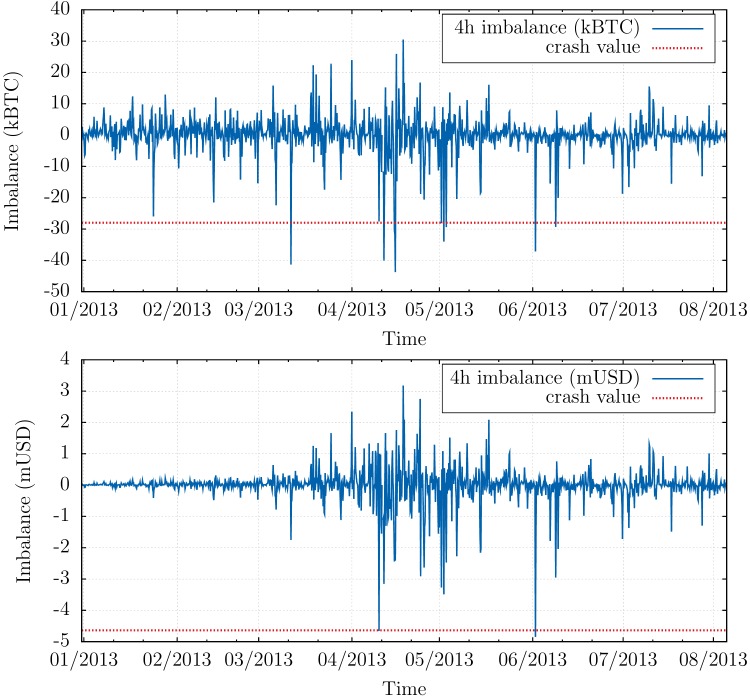
Fig 2. Order flow imbalances in USD and BTC.
Top: Aggressive imbalance in order flow ∑i ϵ i v i (where ϵ i = ±1 is the sign of the transaction, and v i its volume in Bitcoins), aggregated over periods of 4 hours between January 2013 and August 2013, expressed in Bitcoins. April 10, 2013 (for which the realised imbalance is represented as a dashed horizontal line) does not appear as an outlier. Bottom: aggressive imbalance in order flow ∑i ϵ i v i p i, aggregated over periods of 4 hours between January 2013 and August 2013 and expressed in USD. April 10, 2013 now clearly appears as an outlier.

