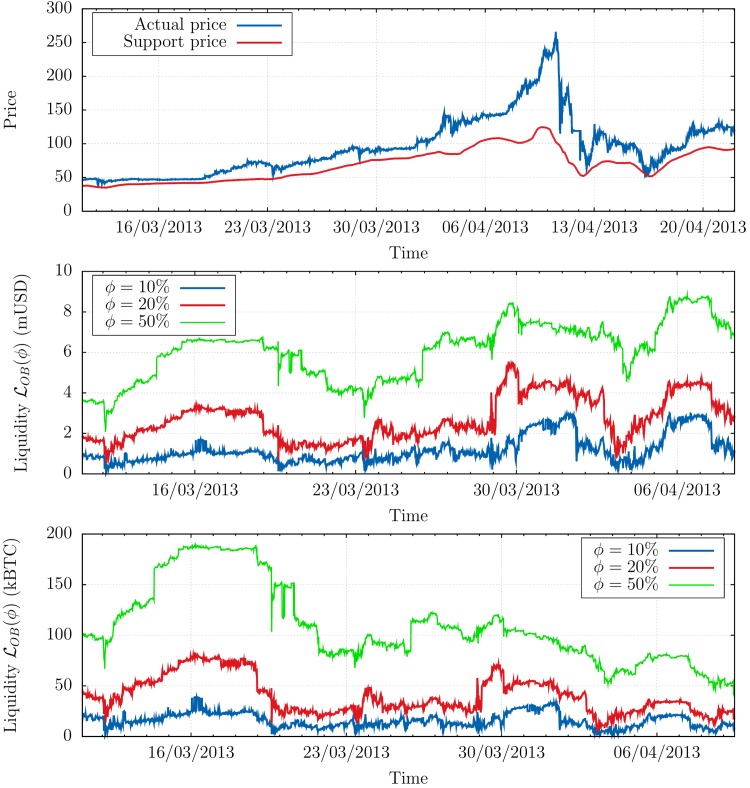
Fig 3. Liquidity and support price.
Top: Actual price p t (blue) vs. support price (red) defined as the price that would be reached if a typical sell-off of 40,000 BTC was to occur instantaneously. Note that is ≈ 50% below the price p t just before the crash, explaining the order of magnitude of the move that happened that day. Middle (resp. Bottom): Buy volume in USD (resp. BTC) in the order book, during the months preceding the crash of April 10, 2013, measured as the volume between the current price p t and p t(1 − ϕ) where ϕ = 10%, 20% and 50%. One can see that for any quantile the liquidity in USD tended to increase by an overall factor ≃ 2 during the period, while the liquidity in BTC was decreased by a factor ≃ 2 − 3 as an immediate consequence of the bubble.

