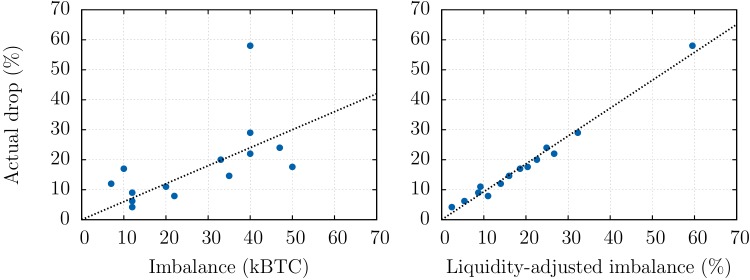
Fig 4. Forecast of crashes amplitudes using order book volumes.
For the 14 most extreme negative returns that have occurred between Jan 1, 2013 and Apr 10, 2013, we compare the realised return with: (Left) the net imbalance during the period (usually a few hours) and (Right) the liquidity-adjusted imbalance . This illustrates the relevance of the liquidity measure to predict the amplitudes of crashes—even in the most extreme cases.

