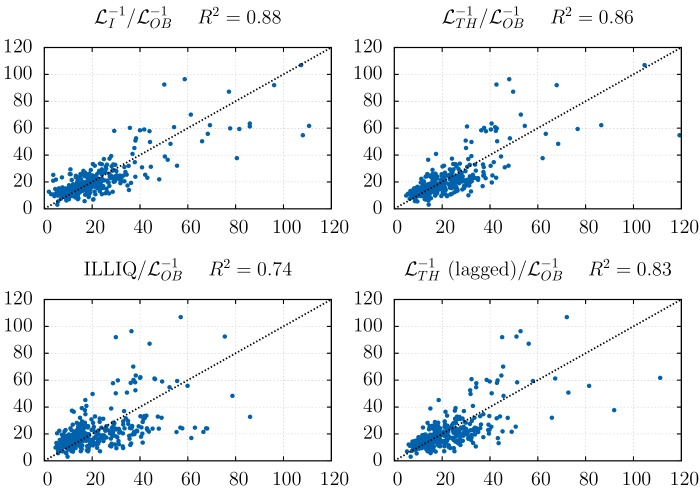
Fig 6. Regression of the actual (il-)liquidity against the different (il-)liquidity measures.
Regression of the actual illiquidity on three same-day illiquidity measures (after rescaling so that the samples means coincide): The direct measure of orders market impact , the publicly available measure that corresponds to the theoretical and empirical impact, and the well-known Amihud ILLIQ measure [39]. Both and outperform ILLIQ (R 2 ≈ 0.86 vs. 0.74). Note that a high predictability remains when lagging by one day (R 2 ≈ 0.83 vs. 0.71). The regression slopes for the four graphs are, respectively: 0.9, 0.95, 0.87 and 0.93.

