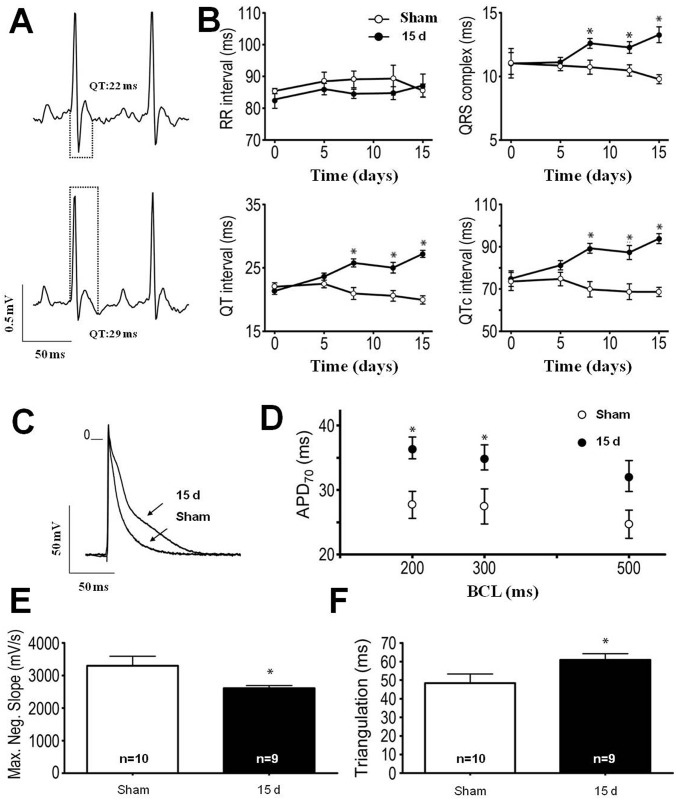
Fig 3. Renal I/R-induced cardiac electrical disturbances in C57BL/6J wild type mice.
(A) Representative traces of electrocardiograms from Sham (upper) and I/R mice (bottom) 15 days after intervention. Dots show the differences in QT duration. (B) Temporal follow-up of RR, QRS, QT and QTc at 0, 5, 8, 12 and 15 days after pedicle manipulation (Sham, n = 10) or reperfusion release (I/R mice, n = 9). Data are mean ± SEM. * P < 0.05 with respect to the corresponding day-matched Sham group (one way ANOVA followed by Bonferroni post-test for selected pairs). (C) Representative action potential traces from left ventricle endocardial tissue recorded from a Sham mouse and an I/R mouse 15 days after intervention. (D) This graph summarizes the duration of action potential at 70% repolarization (APD70) under different basic cycle lengths (BCL) of stimulation (200, 300 and 500 ms). * P < 0.05 with respect to the corresponding BCL-matched 15 days Sham group (one-way ANOVA followed by Bonferroni post-test for selected pairs). (E and F) These bar graphs summarize the maximal negative slope of repolarization (E) and triangulation duration (F) found in Sham and 15 days I/R mice. Data are mean ± SEM. *P < 0.05 with respect to Sham (Student t-test). Recordings from 5–7 hearts; 7–9 cells per heart.

