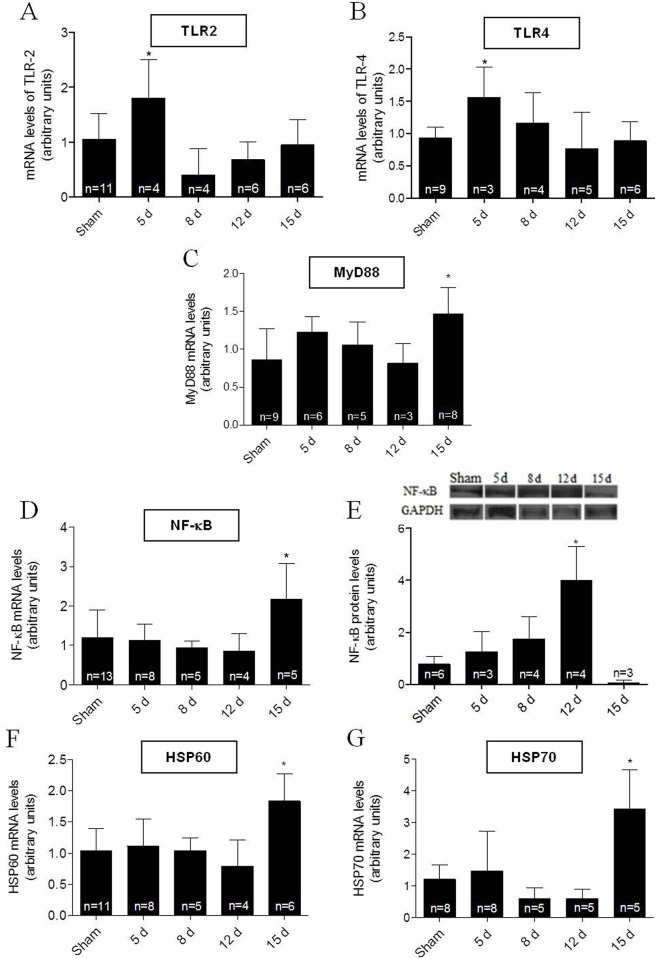
Fig 4. Cardiac TLR2 and 4 pathway after renal I/R in C57BL/6J wild type mice.
Measurements were carried out in heart tissues at the times after I/R given on the abscissae. In all experiments, the Sham group corresponds to assays carried out using mice 15 days after intervention. (A to D) mRNA expression levels of TLR2, TLR4, MyD88 and NF-κB p105. (E) NF-κB p105 protein abundance; GAPDH: control for protein loading. (F and G) mRNA expression levels of HSP60 and HSP70, respectively. Data are mean ± SD; n: indicated within the bars. *P < 0.05 compared to the corresponding Sham group (one-way ANOVA followed by Bonferroni post-test for selected pairs).

