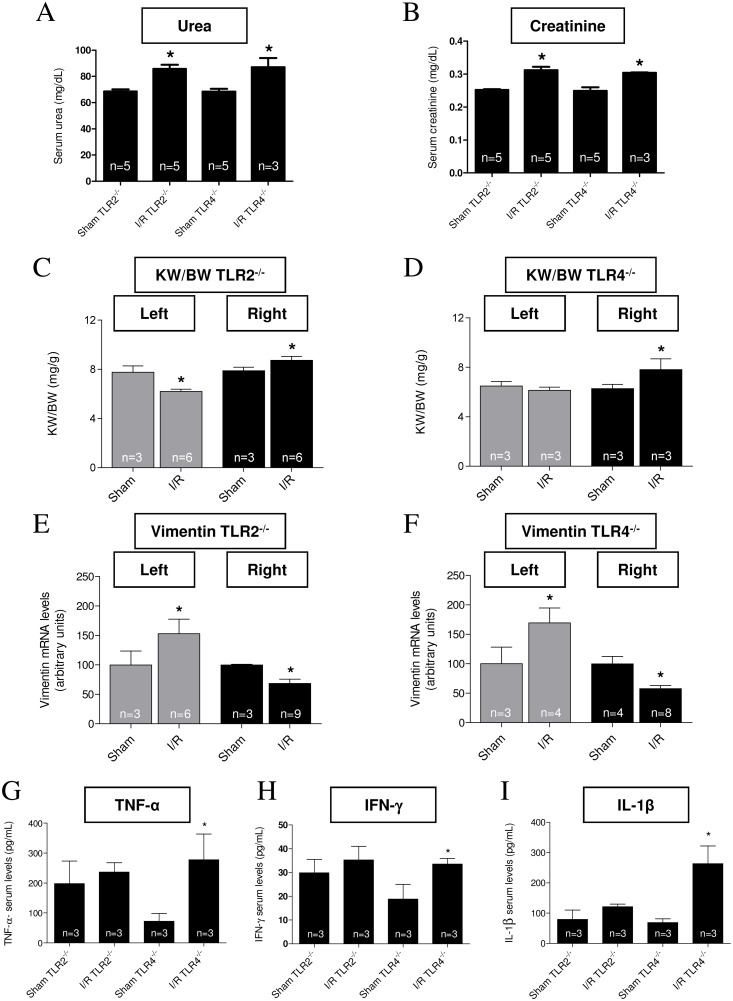
Fig 6. Renal status in TLR2-/- and TLR4-/- 15 days after I/R.
Data are mean ± SD; number of animals within the bars. (A and B) Serum urea and creatinine levels in TLR2-/- and TLR4-/- from I/R mice measured using the Analisa kit, and compared to those from the corresponding Sham (15 days after intervention), as indicated on the abscissae. * P <0.05 with respect to the Sham group (one-way ANOVA followed by Bonferroni post-test for selected pairs). (C and D) Kidney weight/body weight ratio (KW/BW) in TLR2-/- and TLR4-/- (Sham and I/R mice 15 days after intervention). Gray bars: left kidney; black bars: right kidney. (E and F) Renal vimentin mRNA levels in TLR2-/- and TLR4-/- (Sham and I/R mice 15 days after chirurgical intervention). Gray bars: left kidney; black bars: right kidney. In C to F: * P < 0.05 with respect to the corresponding Sham kidney (one way ANOVA followed by Bonferroni post-test for selected pairs). (G to I) TNF-α, IFN-γ and IL-1β serum levels from TLR2-/- and TLR4-/- mice (Sham and I/R, as shown on the abscissae, 15 days after intervention). *P < 0.05 when the I/R group was compared with the corresponding Sham (one-way ANOVA followed by Bonferroni post-test for selected pairs).

