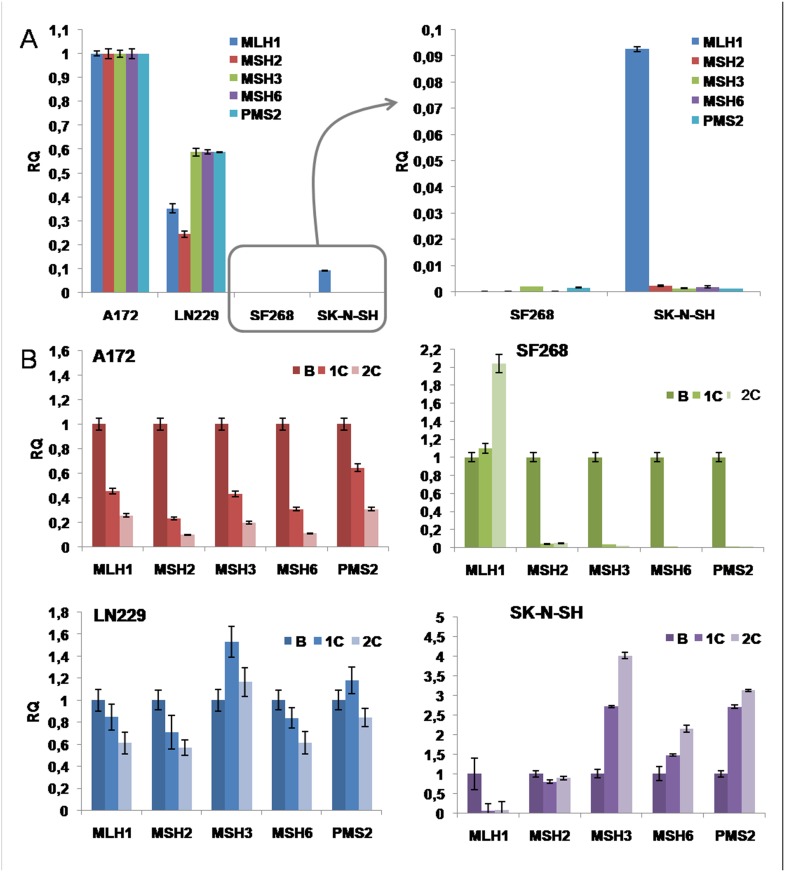
Fig 6. Modulation of MMR expression by TMZ treatment.
A) Real-time PCR analysis of MMR gene expression levels (MLH1, MSH2, MSH3, MSH6 and PMS2) in tumor cell lines. B) Modulation of MMR gene expression levels after TMZ treatment in tumor cell lines. B: basal cells; 1C: first TMZ cycle; 2C: second TMZ cycle. All data represent the mean value ± SD of triplicate cultures.

