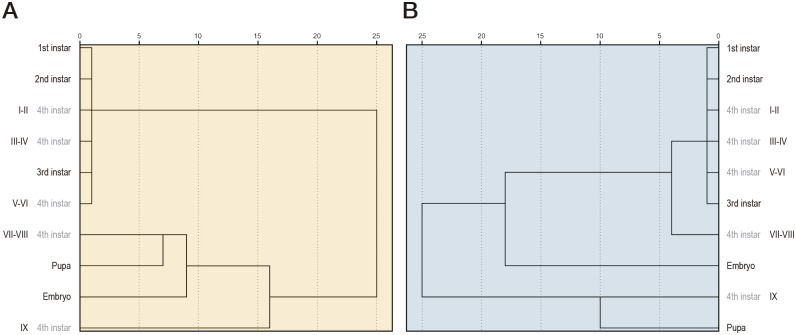
Fig 4. Hierarchical clustering dendrogram of the groups established for the expression analysis of ecdysone related genes.
Cluster analysis arranges biological samples into groups based on the expression levels measured in female (A) and male (B) larvae. Relationships among samples are represented by a dendrogram whose branch lengths reflect the degree of similarity between them as assessed by pairwise comparisons of gene expression profiles. Two groups of developmental stages or phases are clearly separated with slight differences between sexes: 1) 1st, 2nd, 3rd instar larvae and early 4th instar phases; and 2) late 4th instar larvae, pupa and embryo. The root represents the whole data set and a leaf corresponds to a single object in it. An internal node represents the union of all objects in its sub-tree. The weight of an internal node represents the distance between its two child nodes.

