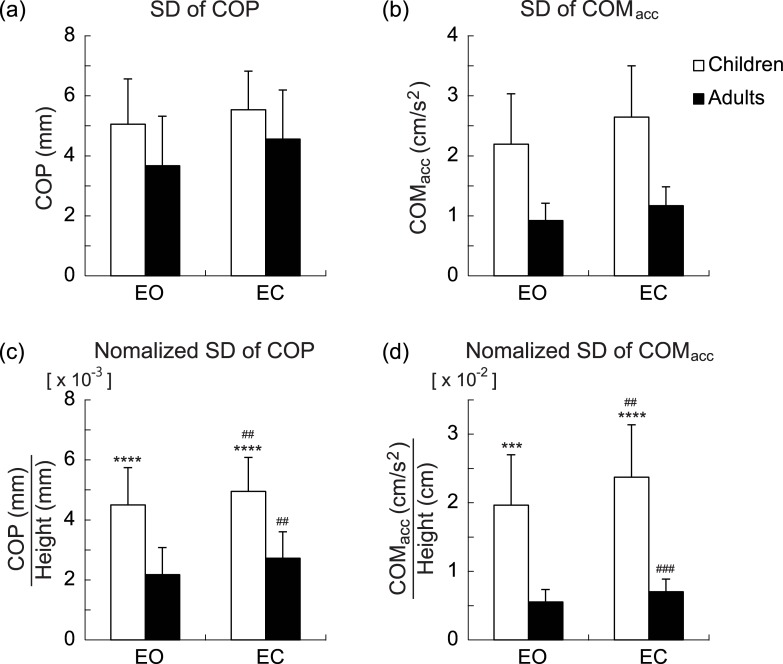
Fig 2. Group mean values of SD of center of foot pressure (COP), and center of mass acceleration (COMacc).
Group mean values of unnormalized SD of COP (a) and COMacc (b) for each age group and visual condition, and normalized COP (c) and COMacc (d). White and black bars indicate child and adult groups, respectively. Data are group means ± SD. *** and **** indicate statistical significances of P < 0.001 and P < 0.0001, respectively, between age groups. ## and ### indicate statistical significances of P < 0.01 and P < 0.001, respectively, between visual conditions.

