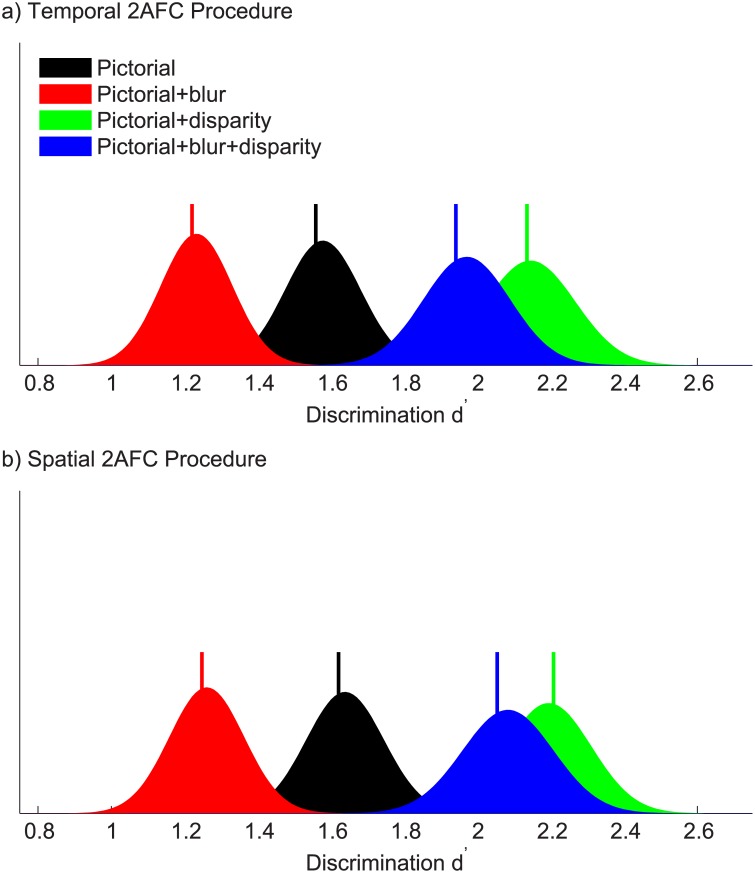
Fig 8. Discrimination sensitivity.
Discrimination sensitivity d’ for each condition in the (a) temporal 2AFC task and (b) spatial 2AFC task, averaged over the four observers in each experiment. The graphs show group bootstrapped distributions of discrimination d’ for the four experimental conditions. Vertical bars represent the true group means.

