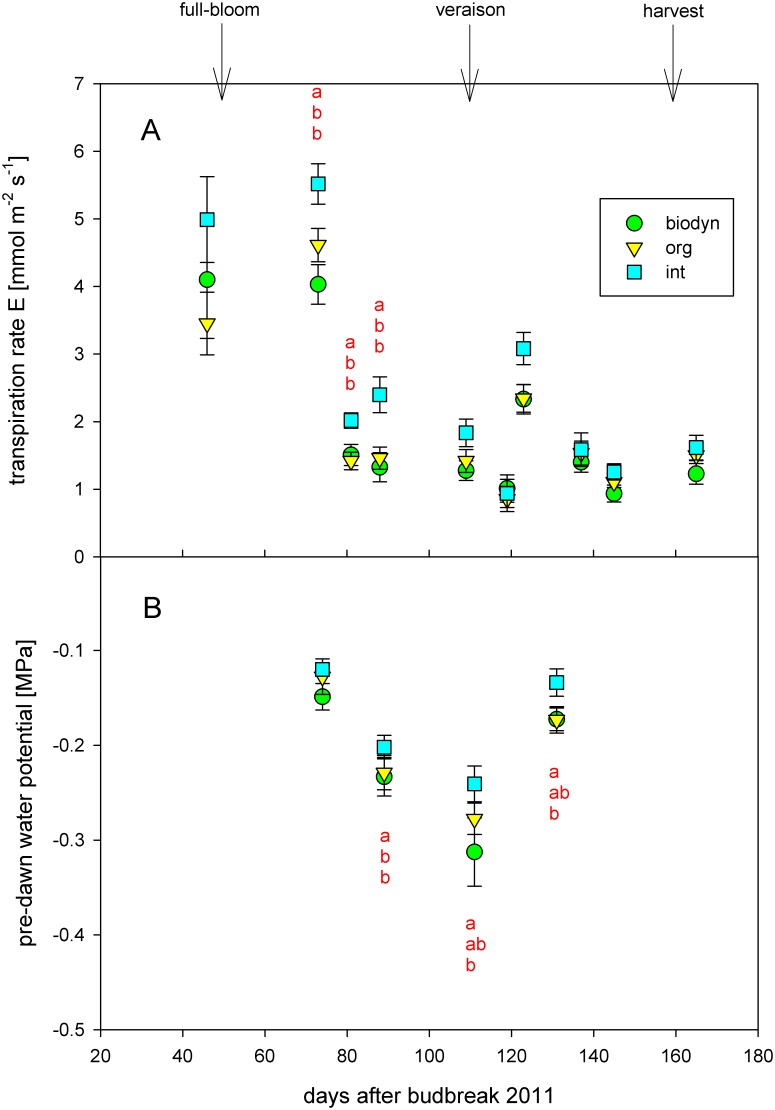
Fig 2. (A) Transpiration rate E [mmol m-1 s-1] and (B) pre-dawn water potential Ψpd [MPa] in 2011.
Means ± se per management system. Different letters indicate statistically significant differences (ANOVA and Tukey`s test, p<0.05) for the specific date. Arrows indicate full-bloom, veraison and harvest, respectively (int = integrated treatment, org = organic treatment, biodyn = biodynamic treatment).

