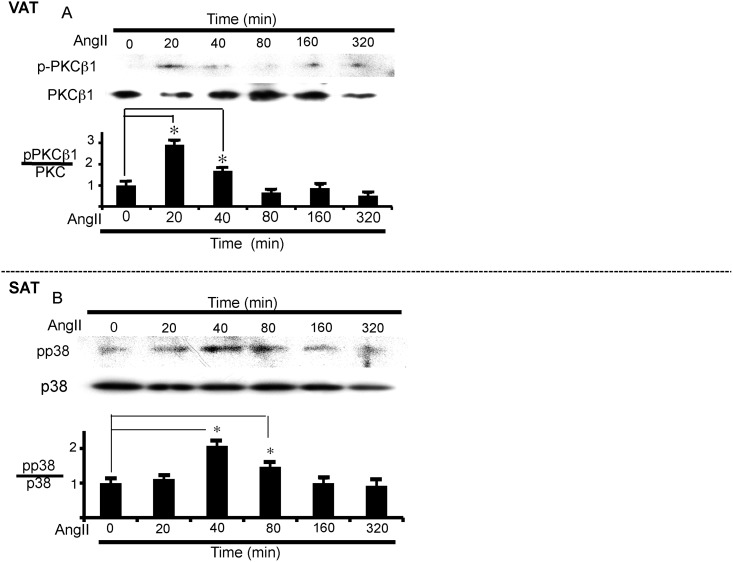
Fig 4. PKCβ1 and p38 MAP kinase activation by AngII in VAT and SAT, respectively.
(A) PKCβ1 activation over time in VAT. VAT was incubated with AngII (1 μM) for the indicated times to measure PKCβ1 phosphorylation. The ratio of phospho-PKCβ1 to total PKCβ1 was calculated based on densitometric quantification of the bands. (B) p38 MAP kinase activation over time in SAT. SAT was incubated with AngII (1 μM) for the indicated times to measure p38MAP kinase. The ratio of phospho-p38 to total p38 was calculated based on densitometric quantification of the bands. Each column and bar represents the mean ± SEM for three separate experiments. An asterisk (*) indicates p<0.05 vs. time 0.

