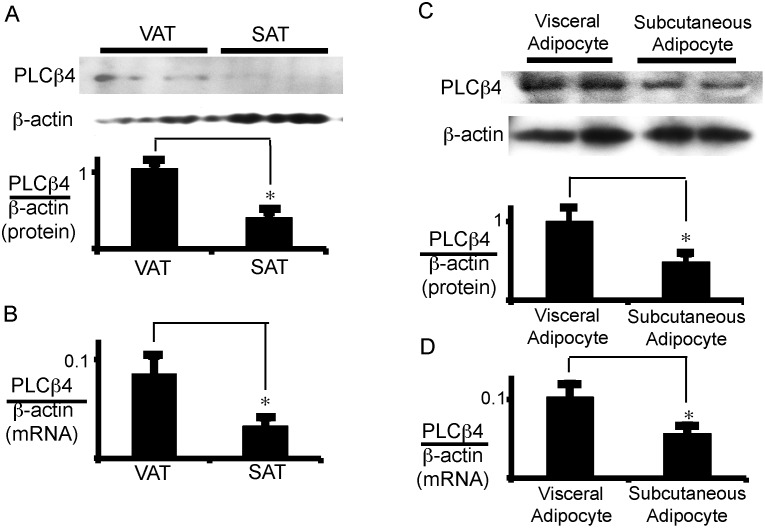
Fig 6. PLCβ4 is highly expressed in VAT and visceral adipocytes.
Total protein (A, C) and total RNA (B, D) was extracted for western blot analysis of PLCβ4 protein and for qRT-PCR analysis of PLCβ4 mRNA, respectively (A and B, adipose tissue; C and D; adipocytes). Duplicated samples in each group were processed for western blotting. Each column and bar represents the mean ± SEM of 6 values from three separate experiments. An asterisk (*) indicates p<0.05 vs. VAT or visceral adipocytes. In panel A and C, the ratio of PLCβ4 to β-actin was calculated based on densitometric quantification of the bands. In panel B and D, PLCβ4 mRNA levels were normalized to β-actin.

