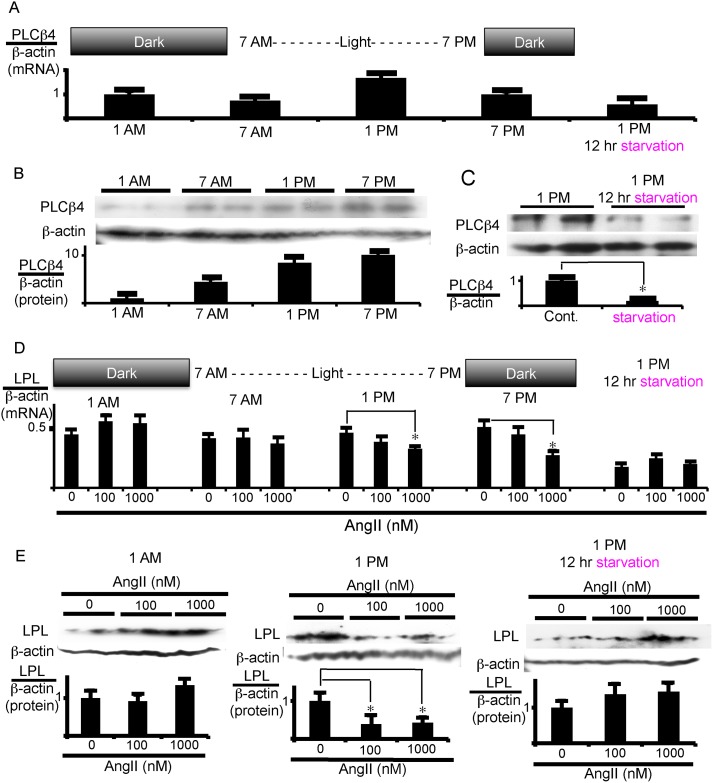
Fig 8. PLCβ4 expression is regulated by feeding/fasting cycle in VAT.
VAT was isolated every 6 h (A, B, D, and E), or after fasting for 12 h from 1 a.m. to 1 p.m. (in the right panel of A, C, D, and E). (A-C) Daily change and starvation effects on PLCβ4 expression in VAT. Total RNA (A) or protein (B, C) was extracted for measurement of mRNA and protein expression of PLCβ4, respectively. (D, E) Effects of PLCβ4 expression levels on the LPL response to AngII in VAT. VAT was treated with the indicated doses of AngII. After 12 h incubation, LPL mRNA levels (D) and, after 18 h incubation, total LPL protein levels (E) were measured. Each column and bar represents the mean ± SEM of 4 values from 2 separate experiments for mRNA measurement (A and D) and 3 values from 3 separate experiments for western blotting experiments. An asterisk (*) indicates p<0.05 vs. control or without AngII. In panel B, C, and E, the ratio of LPL or PLCβ4 protein to β-actin was calculated based on densitometric quantification of the bands. In panels A and D, mRNA levels were normalized to β-actin mRNA.

