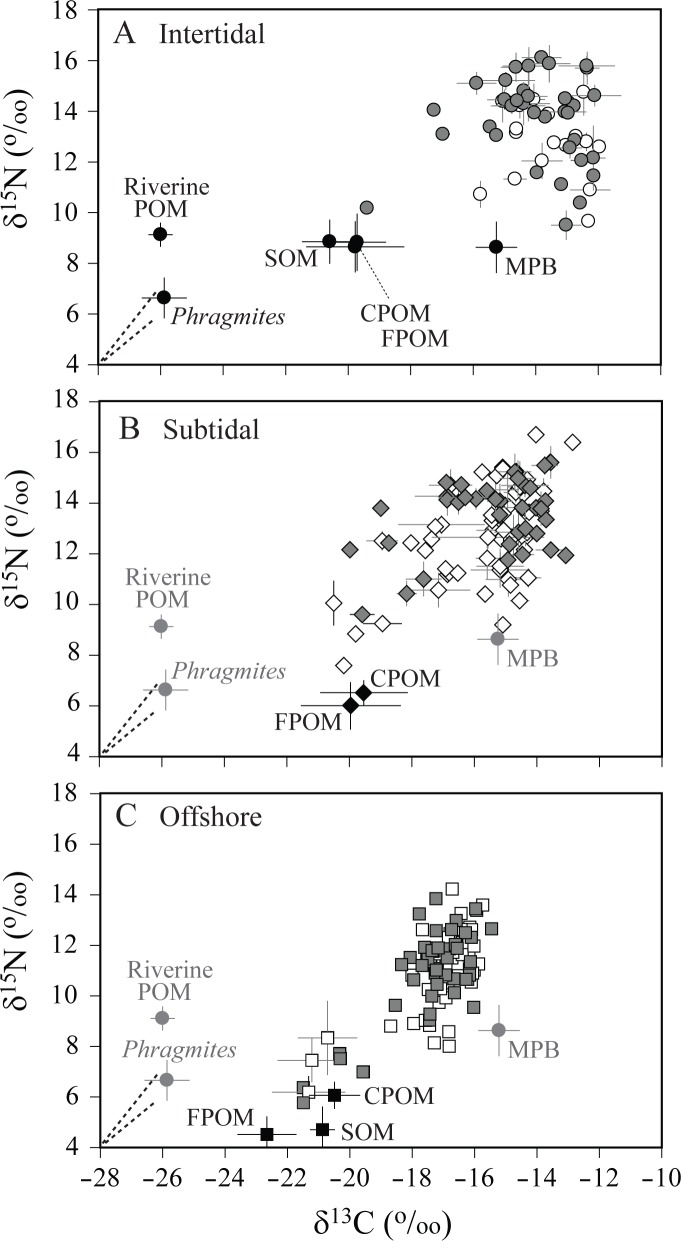
Fig 4. Dual plots of mean δ13C and δ15N values for food sources (black color) and consumers in spring (white) and fall (gray) in (A) intertidal, (B) subtidal, and (C) offshore habitats.
Vertical and horizontal bars represent standard deviations. FPOM, fine (< 20 μm) suspended particulate organic matter; CPOM, coarse (> 20 μm) suspended particulate organic matter; SOM, sedimentary organic matter; MPB, microphytobenthos; Phragmites, Phragmites australis; Riverine POM, Riverine particulate organic matter [57]. MPB, Phragmites, and Riverine POM are in grey on B and C plots because they were not sampled at the subtidal and offshore areas. Dashed lines indicate the average trophic enrichment factors of +1.7‰ and +1.7‰ for δ13C and δ15N values in the ark shells; +1.8‰ and +2.8‰, respectively, in the oysters obtained in the present study.

