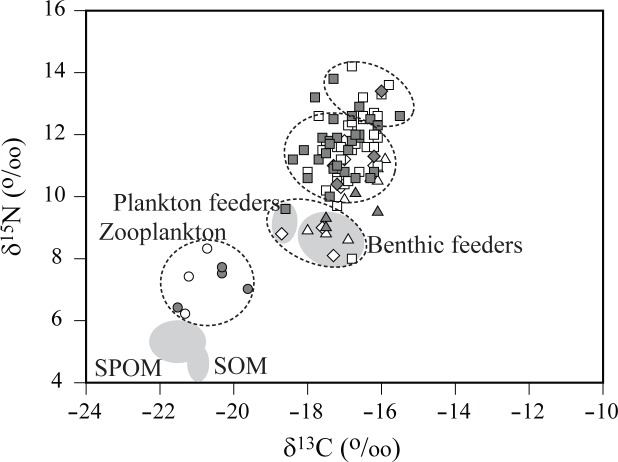
Fig 8. Dual plots of mean δ13C and δ15N values for zooplankton, other invertebrates, and fish in spring (white) and fall (gray) in offshore habitats.
The groups of taxa were clustered according to the result of hierarchical cluster analysis (see details in Methods). Circle, zooplankton; triangle, arthropods; diamond, mollusks; square, fish. Grey ellipses represent suspended particulate organic matter (SPOM) and sedimentary organic matter (SOM). Species name and isotope data are given in S1 Appendix.

