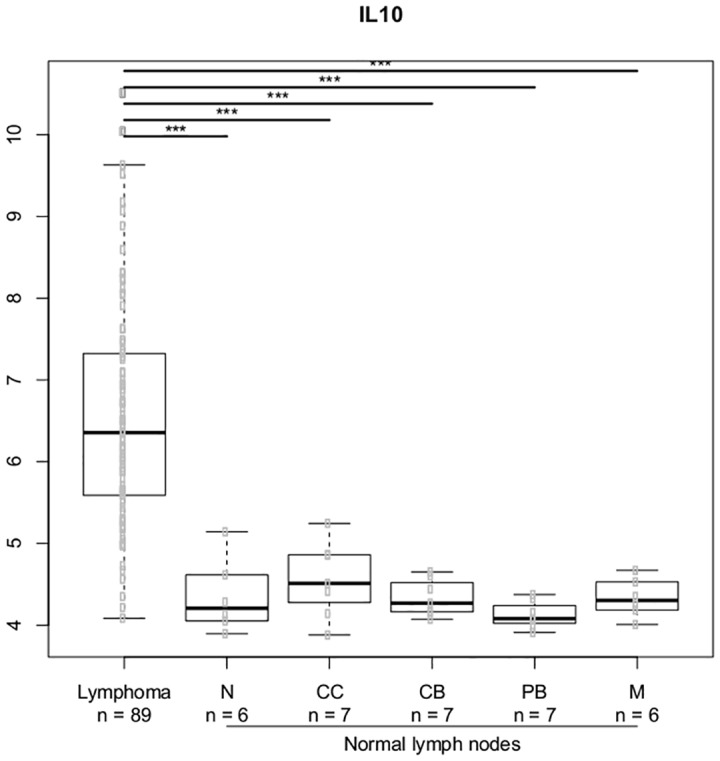
Fig 7. Gene expression for the IL10 gene.

The asterisk represents significant difference in expression after Bonferroni correction (*** = p < 0.001, ** = p< 0.01, * = p < 0.05). Gene expression is presented on a log2 scale. Lymphoma: DLBCL B-cells, N: Naïve B-cells, CC: Centrocytes, CB: Centroblasts, PB: Plasmablasts, M: Memory B-cells.
