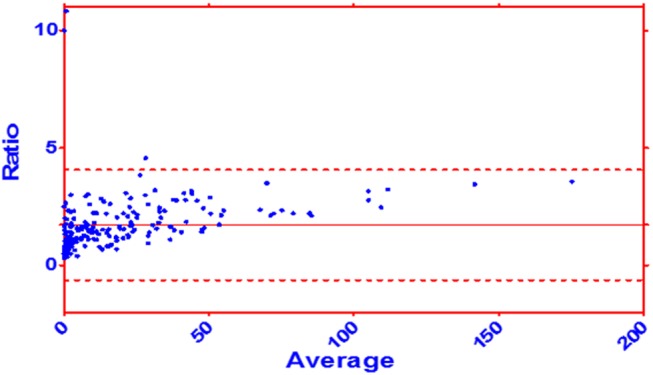
Fig 3. Bland-Altman plot for comparing the od-value with the volumetric acquired lesion volume.

Dataset of the day 1 and day 2 combined. Ratio: volumetric volume / od-value. Average: (volumetric volume + od-value) / 2. Mean: 1.722 ± 1.96 SD: -0.626 to 4.071.
