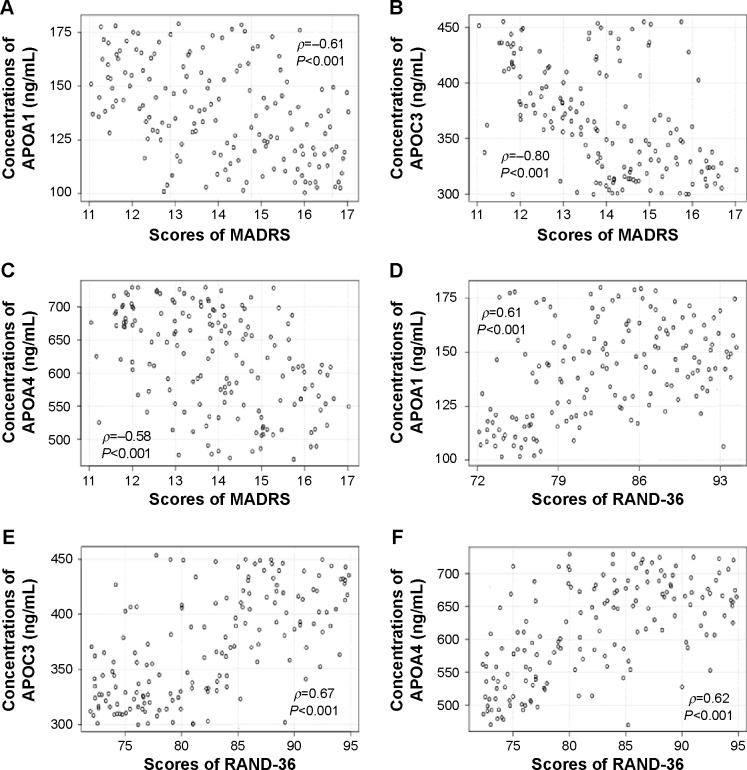
Figure 4.
Relationship between MADRS or RAND-36 scores and APOA1/APOC3/APOA4 levels in healthy subjects.
Notes: (A) Relationship between MADRS scores and APOA1 levels. (B) Relationship between MADRS scores and APOC3 levels. (C) Relationship between MADRS scores and APOA4 levels. (D) Relationship between RAND-36 scores and APOA1 levels. (E) Relationship between RAND-36 scores and APOC3 levels. (F) Relationship between RAND-36 scores and APOA4 levels. Statistical analysis was performed using Spearman’s rank correlation test. There is a strong negative correlation if ρ-values are between −1 and −0.5. There is a strong positive correlation if the ρ-values are between 0.5 and 1.
Abbreviation: MADRS, Montgomery–Åsberg Depression Rating Scale.

