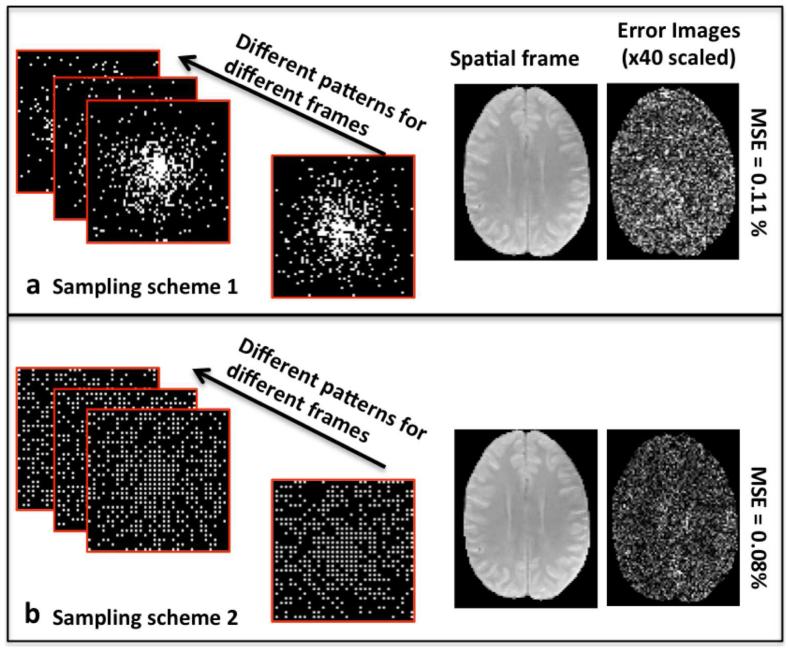
Fig. 2.
Choice of sampling trajectories: The sampling patterns for a specific frame for the two choices of sampling schemes are shown in (a) and (b), respectively. The results are shown for an under-sampling factor of 8. The first sampling scheme (shown in (a)) is a pseudo-random variable density pattern, while the second sampling scheme (shown in (b)) is a combination of a uniform 2×2 under-sampling pattern and a pseudo-random variable density pattern. The second column shows one of the weighted images of the reconstructed data using BCS. As seen from the error images in third column, sampling scheme 2 yields better performance. Note that the sampling patterns are randomized over different parameter values to increase incoherency.

